DollarCollapse.com

It's Coming...

HAA

  • Home
  • About
  • Breaking News
  • Articles
    • Creeping Fascism
    • Currency War
    • debt
    • Dollar
    • Economy
    • Inflation
    • Monetary policy
    • Precious Metals
    • Stock prices
    • Videos
  • Buy Gold And Silver
  • Join The Email List
  • Contact

One Table And Two Charts Show Why Stocks Are A Bad Place To Be

by John Rubino ◆ October 22, 2020 23 Comments

US stocks are behaving amazingly well given the political and economic near-chaos of the past few months. This is probably the first recession that inflated rather than popped financial asset bubbles.

Why? Because panicked governments and central banks are dumping trillions of play-money dollars into the system, a big part of which flow directly into the brokerage accounts of the 1%.

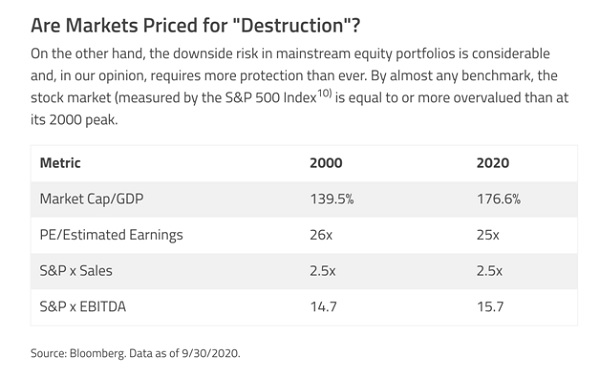
The result is a stock market that looks very familiar to financial historians. But not in a good way. Here’s a table from money manager Lawrence Lepard comparing today’s S&P 500 to its predecessor at the peak of the 1990s tech stock bubble.

Stocks today vs 2000 stocks are a bad place to be

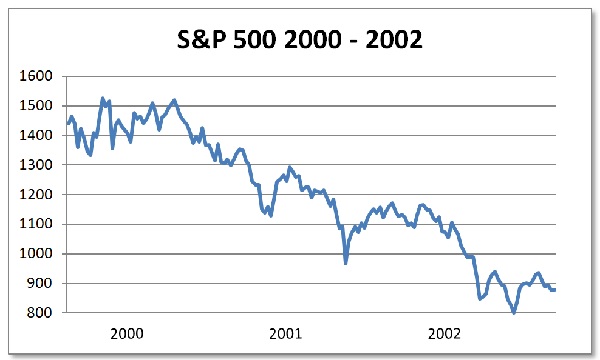
And here’s what the S&P 500 did following that 2000 valuation peak:

S&P 500 200-2002 stocks are a bad place to be

Next is a chart from Hussman Funds (always a good source of terrifying stock market visuals) showing the S&P 500’s behavior as it fluctuates around Hussman’s favorite market valuation measure. Their explanation:

The chart below is a reminder of where the S&P 500 stands relative to levels that we would consider “durable.” The blue line shows the S&P 500, the green line shows our best estimate of historical valuation norms at each point in time, and the red line shows “durable” levels in the S&P 500 that were never again breached in later cycles. Notice in particular that market advances toward valuation norms (that is, blue line below green line) tend to be durable. In contrast, market advances far beyond valuation norms (blue line above green line) tend to be transient, and are often wiped out over the completion of the market cycle, or even the following market cycle, as was the case in 2009.

Hussman stock valuations stocks are a bad place to be

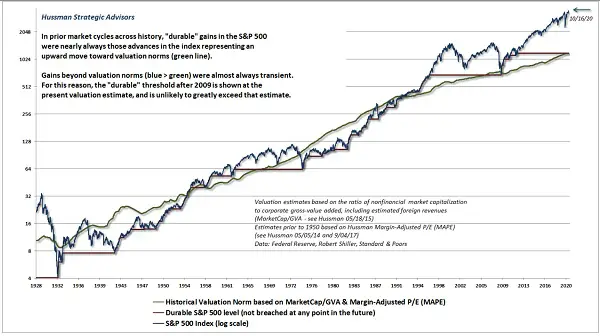
This pattern points to an imminent give-back of the past few years’ overexuberant gains.

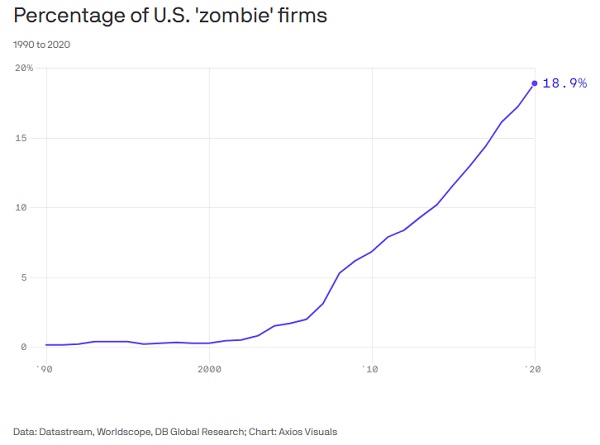
And last but not least, zombies
Another effect of long equity bull markets is a growing population of companies that are only viable in the easiest of easy money environments.

“Zombie” companies, for instance, have debt service costs that exceed their profits, so they can’t survive without continuous infusions of new capital. They are, not surprisingly, the first to go when financial conditions become even slightly less easy. And there are now more of them than ever before. Chart courtesy of Real Investment Advice.

Zombie companies stocks are a bad place to be
Clearly, this is another of those “peak insanity” markets that emerge during credit bubbles. Here’s why it matters so much today: This level of financial fragility and equity overvaluation gives the financial markets veto power over government policy. If future administrations and/or central banks even think about tightening fiscal or monetary conditions, the air pockets under stock prices will act as a deterrent, leaving governments around the world with no choice but to stay their current course. That means zero-to-negative interest rates and massive ongoing credit creation basically forever.

So the question becomes, what unintended consequences will flow from emergency levels of monetary ease becoming permanent? This, at least, is easy to answer: Inflation, extreme volatility, currency crisis, and soaring gold and silver.

An ugly world, in other words, but one full of opportunities.

Emigrate While You Still Can – To Finca Bayano

Trackbacks

  1. One Table And Two Charts Show Why Stocks Are A Bad Place To Be – Investment Watch - Female Investors Daily says:
    October 22, 2020 at 10:40 pm

    […] BY JOHN RUBINO […]

    Reply
  2. One Table And Two Charts Show Why Stocks Are A Bad Place To Be – R² Research says:
    October 22, 2020 at 11:34 pm

    […] post One Table And Two Charts Show Why Stocks Are A Bad Place To Be appeared first on […]

    Reply
  3. One Table and Two Charts Show Why Stocks Are a Bad Place to Be | Financial Survival Network says:
    October 23, 2020 at 5:38 am

    […] by John Rubino Dollar Collapse […]

    Reply
  4. Why Stocks Are A Bad Place To Be (In 1 Table & 3 Charts) – MAGAtoon says:
    October 23, 2020 at 12:32 pm

    […] Authored by John Rubino via DollarCollapse.com, […]

    Reply
  5. Why Stocks Are A Bad Place To Be (In 1 Table & 3 Charts) - Nemos News Network says:
    October 23, 2020 at 12:34 pm

    […] Authored by John Rubino via DollarCollapse.com, […]

    Reply
  6. [ZEROHEDGE] Why Stocks Are A Bad Place To Be (In 1 Table & 3 Charts) | Liquidary.com says:
    October 23, 2020 at 12:35 pm

    […] Authored by John Rubino via DollarCollapse.com, […]

    Reply
  7. Why Stocks Are A Bad Place To Be (In 1 Table & 3 Charts) | BringingTheMessage.com says:
    October 23, 2020 at 12:37 pm

    […] Authored by John Rubino via DollarCollapse.com, […]

    Reply
  8. Why Stocks Are A Bad Place To Be (In 1 Table & 3 Charts) – iftttwall says:
    October 23, 2020 at 12:38 pm

    […] Authored by John Rubino via DollarCollapse.com, […]

    Reply
  9. Why Stocks Are A Bad Place To Be (In 1 Table & 3 Charts) - Open Mind News says:
    October 23, 2020 at 12:38 pm

    […] Authored by John Rubino via DollarCollapse.com, […]

    Reply
  10. Why Stocks Are A Bad Place To Be (In 1 Table & 3 Charts) - Grand Ole Party says:
    October 23, 2020 at 12:41 pm

    […] Authored by John Rubino via DollarCollapse.com, […]

    Reply
  11. Why Stocks Are A Bad Place To Be (In 1 Table & 3 Charts) – MDC News Today says:
    October 23, 2020 at 12:42 pm

    […] Authored by John Rubino via DollarCollapse.com, […]

    Reply
  12. Why Stocks Are A Bad Place To Be (In 1 Table & 3 Charts) – BREAKING News, Politics, and Opinion says:
    October 23, 2020 at 12:43 pm

    […] Authored by John Rubino via DollarCollapse.com, […]

    Reply
  13. Why Stocks Are A Bad Place To Be (In 1 Table & 3 Charts) – American Broadcasting CommUnity says:
    October 23, 2020 at 12:44 pm

    […] Authored by John Rubino via DollarCollapse.com, […]

    Reply
  14. Why Stocks Are A Bad Place To Be (In 1 Table & 3 Charts) – Finanz.dk says:
    October 23, 2020 at 12:45 pm

    […] Authored by John Rubino via DollarCollapse.com, […]

    Reply
  15. Why Stocks Are A Bad Place To Be (In 1 Table & 3 Charts) | Zero Hedge says:
    October 23, 2020 at 1:09 pm

    […] Authored by John Rubino via DollarCollapse.com, […]

    Reply
  16. Why Stocks Are A Bad Place To Be (In 1 Table & 3 Charts) – Investing Money Trends says:
    October 23, 2020 at 1:33 pm

    […] Authored by John Rubino via DollarCollapse.com, […]

    Reply
  17. Why Stocks Are A Bad Place To Be (In 1 Table & 3 Charts) – TradingCheatSheet says:
    October 23, 2020 at 1:47 pm

    […] Authored by John Rubino via DollarCollapse.com, […]

    Reply
  18. Why Stocks Are A Bad Place To Be (In One Table And Three Charts) - Bullion Forecast says:
    October 23, 2020 at 2:11 pm

    […] by John Rubino of Dollar Collapse […]

    Reply
  19. Rubino: One Table And Two Charts Show Why Stocks Are A Bad Place To Be says:
    October 23, 2020 at 2:38 pm

    […] Continue… […]

    Reply
  20. 株式が悪い場所である理由(1つの表と3つのグラフ) | REALTRADE.NEWS says:
    October 23, 2020 at 2:43 pm

    […] 沿って ジョン・ルビノ の ドル崩壊 […]

    Reply
  21. Why Stocks Are A Bad Place To Be (In One Table And Three Charts) – Price of Silver says:
    October 23, 2020 at 3:24 pm

    […] by John Rubino of Dollar Collapse […]

    Reply
  22. One Table And Two Charts Show Why Stocks Are A Bad Place To Be - Free World Economic Report says:
    October 23, 2020 at 5:57 pm

    […] Dollar Collapse  […]

    Reply
  23. One Table And Two Charts Show Why Stocks Are A Bad Place To Be - The Daily Coin says:
    October 23, 2020 at 10:25 pm

    […] One Table And Two Charts Show Why Stocks Are A Bad Place To Be by John Rubino for Dollar Collapse […]

    Reply

Leave a Reply Cancel reply

Your email address will not be published. Required fields are marked *

Lanista

Birch

Biden's Plans to Upend Retirement Accounts

Biden’s Plans to Upend Retirement Accounts

 China Just Attacked the USD

China Just Attacked the USD

Millions to be Hit Hard by this U.S. Scheme to Confiscate Your Savings

Millions to be Hit Hard by this U.S. Scheme to Confiscate Your Savings

Millions to be Hit Hard by this U.S. Scheme to Confiscate Your Savings

The “New World Money Order” to Dethrone the Dollar

The Sneaky IRS Tax Law that's Sweeping the U.S.

The Sneaky IRS Tax Law that’s Sweeping the U.S.

Ultimate Gold Investing Guide

TT gif

RAA right sidebar

Money Bubble

Bullion Vault

Adsense Right Rail


AST Article Right Rail 4

AST Article Right Rail 1 + Jay Taylor ad after social media buttons

Google code for remarketing tag

AST Article Below Post

Hyperlink article ellipses, resize images, truncate previews

Sponsored Post

AST ROS Right Rail 1

Gold price chart

Silver price chart

Dollar index chart

Bitcoin

AST Article Broker Buttons

Whatfinger

Buy Gold And Silver Here

Buy Gold and Silver


Birch Gold Group

Hard Assets Alliance

GoldSilver

GoldMoney

Bullion Vault

Google

Copyright © 2021 · DollarCollapse.com