
The so-called Wall Street economists keep saying that inflation is going to abruptly cool. This prospect is owing to the fact, they claim, that the economy is about to roll-over into recession and especially because shelter costs, which are by far the largest component of the CPI and account for 31% of the weight in the index, are already falling sharply.
We don’t buy either proposition, of course. We think the recession is already here, but the proposition that it will cause an immediate cooling of inflation is just warmed-over Phillips Curve nonsense.
Likewise, the second point essentially amounts to wishful thinking. To wit, it’s based on “asking rents” for newly leased units, which have cooled in the typical fall seasonal pattern at a slightly faster pace than normal. In turn, this is alleged to mean that the great rental inflation boom is already fading into the rear-view mirror.
Well, here’s the chart from the latest Apartment List national rent report. In both pre-Covid years of 2018 and 2019, month-over-month rents fell seasonally in the fall (blue bars) just like they are now. That puts the 0.7% decline reported for October 2022 versus prior month in appropriate context. In a word, it’s not much to write home about, given that October rents in 2019 fell by almost as much at 0.5% on a M/M basis.
Moreover, when we are dealing with a not seasonally adjusted month-over-month data set, the hugely aberrant increases of 2021 must be taken into consideration. For instance, the peak monthly gain in July 2021 amounted to 30% at an annualized rate.
Accordingly, on a two-year stacked basis, the October 2022 asking rent increase is still positive, a clear deviation from the implicit two-year stacked declines during the pre-Covid period.

More importantly, “asking rents” have a very limited meaning. They reflect conditions on the market for new leases as embodied in the soaring rent indices published by private real estate companies like the Apartment List. By definition, however, these new lease rates have yet to roll through the total stock of US residential housing—and we are talking about all 128 million units!
That is to say, there are about 44 million rental units and 84 million homeowner occupied units in the US. In its wisdom the BLS treats this as a giant stock of rental housing via the OER (owners equivalent rent) for the latter and the “rent of primary residence” for the former.
Consequently, in both the real world, as well as the BLS scheme of things, it would take an extended period of time for rent rates on new leases to roll through the entire housing stock. Yet the CPI is designed to represent rent prices paid by all renters during the month (and homeowners who are treated as imputed “renters” in the CPI), not just new renters.
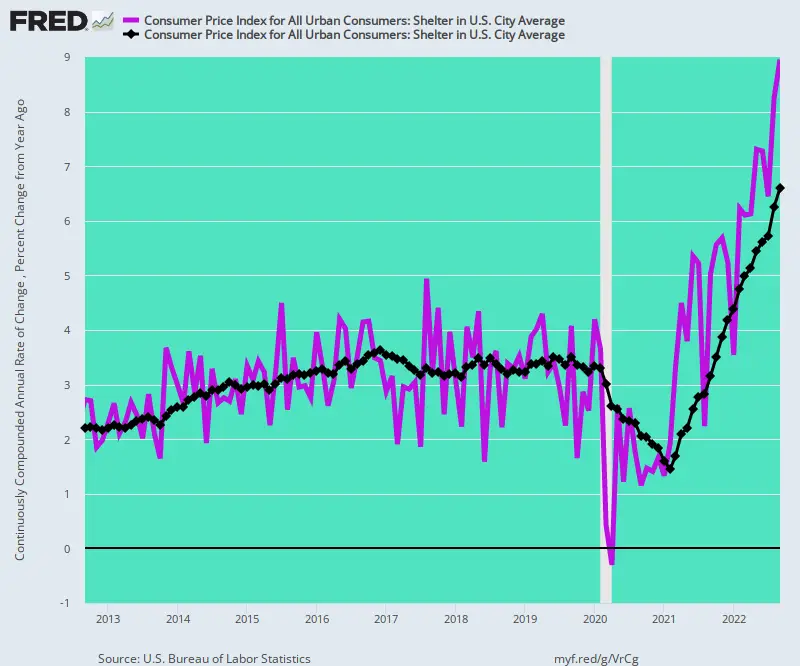
For this reason, the CPI rental indices lag behind private market asking rents by a year or more because it takes at least that long for the rent rolls to turn-over. Not surprisingly, therefore, the annualized rate of CPI rent increases in recent months has accelerated sharply (purple line) as rising asking rents have rolled into the rent rolls.
Thus, during September, the annualized rate of CPI shelter increase was 8.9% versus prior month—a figure well above the Y/Y (black line) gain of 6.6%. Needless to say, even if the purple line now starts cooling consistent with the alleged weakening trend in asking rents, the Y/Y increase for shelter will continue to rise well into 2023.
What happens after that is not at all clear, but one thing is obvious from the Apartment List chart above. To wit, the only “cooling” that has occurred so far is a slightly elevated seasonal decline, which will likely be reversed to seasonal increases early next year if prior history is any guide.
CPI Shelter Index: Y/Y Change (black line) Versus M/M Annualized Increase (purple line),2012-2022
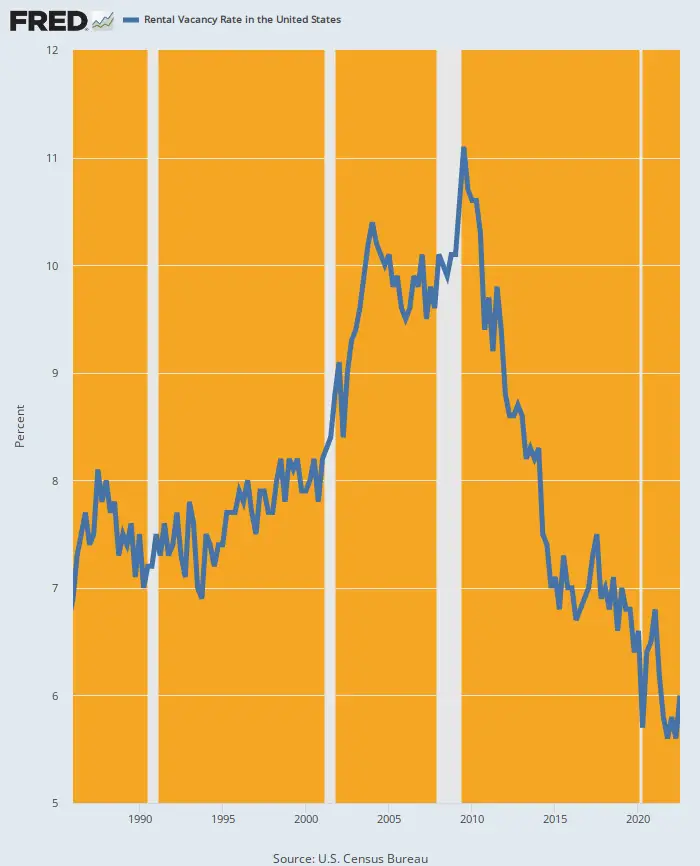
One hint about the future direction of the seasonally adjusted CPI shelter index, however, lies in the tight-as-a-drum rental unit vacancy rate. As of the latest data, (Q2 2022), the 5.6% vacancy rate was a modern low and compared to pre-Covid levels of 6.8% in Q2 2019 and 8.6% in Q2 2018.
In fact, the Q2 apartment vacancy rate was the lowest in 38 years, and since 1956 was matched or exceeded only during the 1970s. And those were not exactly disinflationary years for housing and rental prices.
Rental Housing Vacancy Rate, 1984-2022
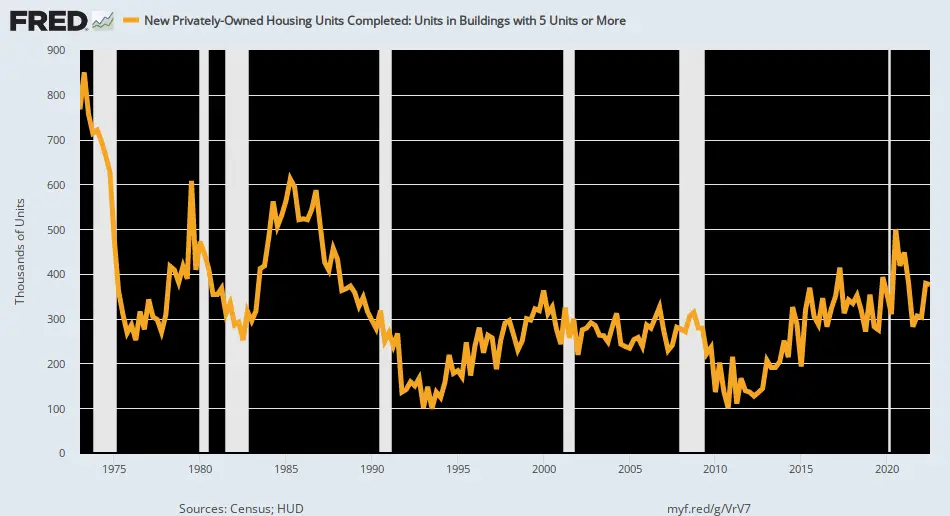
Likewise, there is no evidence that a flood of new rental unit supply is about to come crashing into the market. The 376,000 units (annualized rate) delivered in Q2 2022 were only slightly above recent levels; and they were also well below peak deliveries in the 1970s and 1980s.
In sum, the rental housing market is extremely tight and is likely to remain so for an extended period into the future. Accordingly, the here-comes-deflation crowd is actually making a mountain out of a mole-hill, claiming that an ordinary seasonal decline in asking rents heralds a sharp deceleration of the shelter index.
It doesn’t.
New Apartment Units Completed, 1973-2022
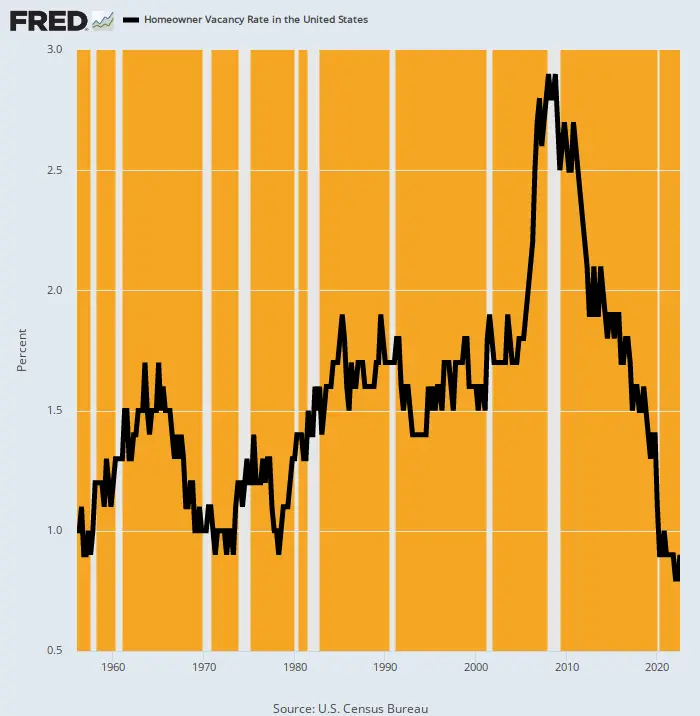
Nor is there any reason to believe that a surfeit of owner-occupied units will flood into the rental market, causing rates to swoon. In fact, the vacancy rate among the 84,840,000 owner-occupied units in the US was just 0.7% in Q2 2022—the tightest vacancy rate for that series since it incepted in 1956!
Stated differently, there are currently only 625,000 vacant owner units in the entire US. That figure compares to a vacancy rate of 1.7% and 1.3 million vacant owner units in Q2 2016, a period when shelter cost rises were already rising at a 3.4% Y/Y rate.
So with a dramatically tighter supply/demand condition today, why in the world would rental rates weaken, let alone plunge toward the flat-line, in the periods just ahead? The excess supply that would be required to sharply cool the home rental markets just isn’t there in either segment of the 131 million unit (counting vacancies) US housing stock.
Homeowner Vacancy Rate, 1956-2022
If shelter is not going to rescue a rising CPI, we doubt whether other services costs will, either. That’s because labor costs are still rising strongly and will pass through into service sector prices in the periods ahead.
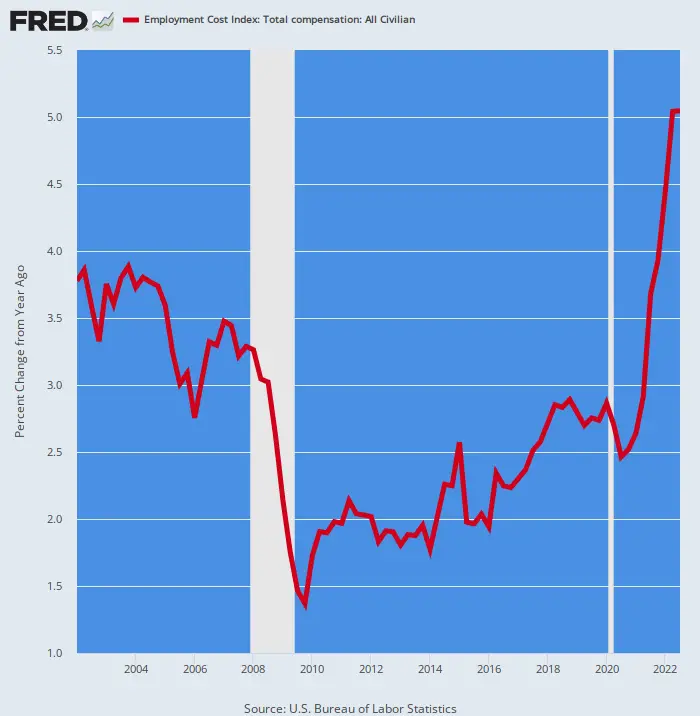
Thus, as reported last Friday total compensation costs during Q3 2022 (including fringes and benefits) rose by 5.1% versus prior year, the highest gain since the series’ inception in 2002. It was also nearly double the 2.3% annualized increase between 2012 and 2019.
So, yes. labor costs have accelerated dramatically since the spring of 2020, and are now working their way into the prices charged by domestic vendors. Accordingly, Wall Street models showing CPI inflation plunging in the periods ahead (2023-2024) are just another case of stock peddlers moonlighting as “economists”.
Y/Y Change In The Employment Cost Index, 2002-2022
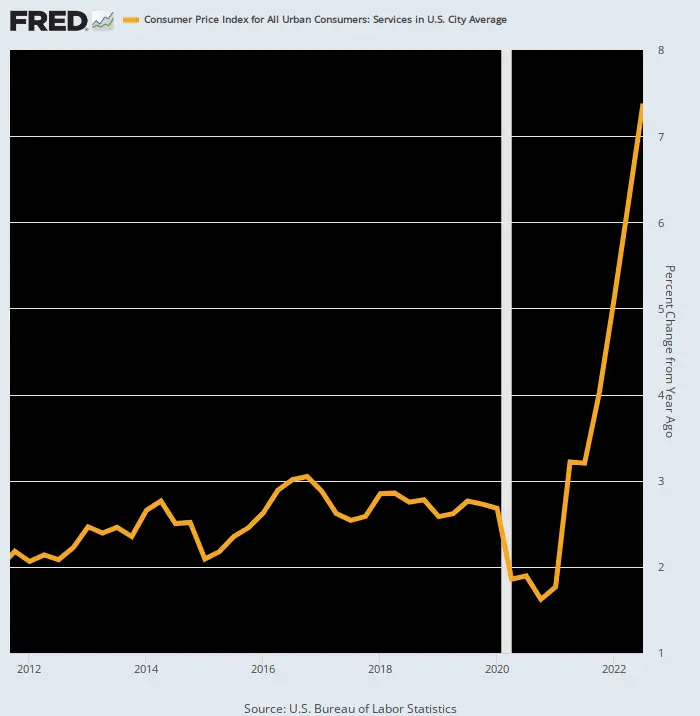
For want of doubt, consider the path of the CPI for services index, which makes up about 60% of the weight in the overall CPI basket. Between 2012 and 2019, it rose by an average of 2.59% per annum, which rate of gain has soared to a record 7.4% in Q3 2022.
That is to say, services inflation has nearly tripled from its pre-Covid steady state owing to the fact that domestic compensation costs have been rising rapidly, as well. Accordingly, it will take a far higher interest rate than the terminal rate of 5.0% which the market has currently priced-in, to bring wage costs and therefore service sector prices back to the Fed’s 2.00% target.
Y/Y Change in CPI For Services, 2012-2022
None of this, however, has stopped the Fed’s favorite whisperer, Nick Timiraos of the Wall Street Journal, from spreading false hope that the Fed’s anti-inflation campaign is nearing its end-stages. In particular, the current “pivot” meme consists of the notion that after the turn of the year the Fed will engage in a prolonged “pause” in its rate increasing campaign.
Supposedly, that’s to permit the monetary policy lag to work its magic, and also because Wall Street can’t stand the heat, whining that the increases have already been too large and prolonged:
Those officials and several private-sector economists have warned of growing risks that the Fed will raise rates too much and cause an unnecessarily sharp slowdown. Until June, the Fed hadn’t raised interest rates by 0.75 point, or 75 basis points, since 1994.
Well, no. The actual fact is that the Fed has not been confronted with soaring, increasingly embedded inflation since the early 1980s and it has never before started a rate increasing campaign from the zero bound.
What the latter means, of course, is that several 75 basis point increases were needed just to rescue Fed policy from its foolhardy embrace of zero interest rates. In turn, this means that its so-called “braking” action has barely begun to bite.
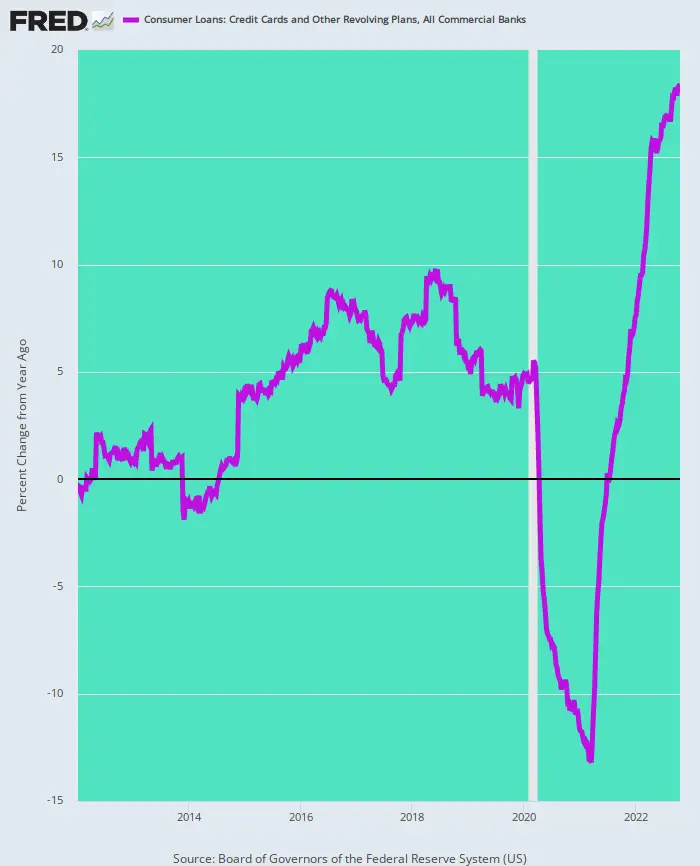
For instance, during the most recently reported week (October 19), the Y/Y increase in outstanding credit card debt hit 18.4%, a level that is self-evidently stoking consumer demand, not curtailing it. Accordingly, the Fed has a lot more interest rate wood to chop before it succeeds in slowing household spending and the resulting inflationary pressures.
Y/Y Change In Credit Card And Other Revolving Consumer Debt, 2012-2022
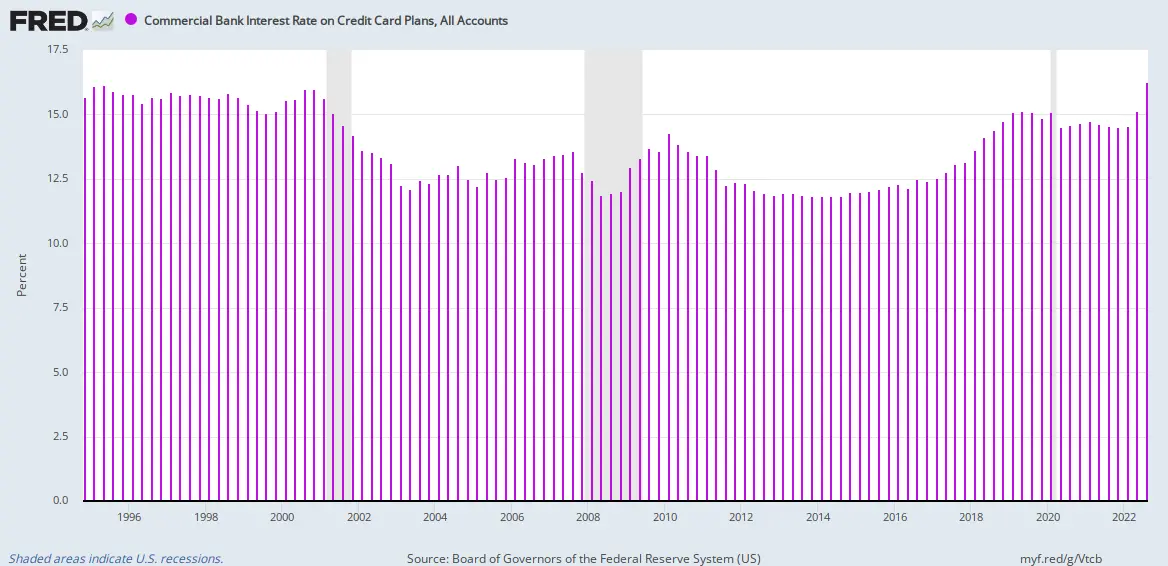
For want of doubt, here is the trend of interest rates on credit card debt. The slight elevation during the past few months barely gets rates back to the level of the 1990s, a period when the CPI was rising at just 2-3% per annum.
In a word, 5% on the Fed funds rate doesn’t cut the anti-inflationary mustard in the current environment. It will take a “rate shock” far higher than currently expected by the Wall Street permabulls and perennial whiners to curtail the inflationary tides that are now assaulting the US economy.
So as one typical Wall Street economist inadvertently averred this AM while pleading for mercy from the Fed at tomorrow’s meeting.
“They have to think about calibration at this meeting. You’re trying to cool down an economy, not throw it into a deep freeze,” said Diane Swonk, chief economist at KPMG.
Well, whether they intend it or not, the “deep freeze” is necessarily exactly where the Fed is taking the inflation-bloated US economy.
Interest Rates On Credit Card Debt, 1994-2022
Another factor which is compounding the Fed’s anti-inflation challenge is the artificial build-up of “savings” during the Covid Lockdowns and resulting stimmy bacchanalia. By estimates of Fed staff, that build-up peaked at about $2.25 trillion during Q3 2021, but has since then been only moderately reduced to about $1.70 trillion. This means that there is still considerable spending power in reserve that has never before been present during a tightening cycle.
Moreover, upwards of half of that excess is held by the top quartile of households (green part of the bars), which households are likely to be the last segment to be impacted by the Fed’s interest raising campaign.
To be sure, the estimated build-up shown below should never have happened in the first place. As we now know, there was never any justification for the Lockdowns, which resulted in sharply reduced spending for services, or the subsequent massive stimmies, which in part ended up in household bank accounts.
But those Washington-fostered distortions did happen, and have made the Fed’s inflation-fighting job all the more difficult.

In any event, when inflation gets embedded in expectations history shows that it stubbornly persists. As shown in the chart below, even after Paul Volcker brought the hammer down on the inflationary tides of that era, and brought inflation readings back to 2.0% (black line) by 1986, medium term consumer inflation expectations (red bars) remained far above actual levels for many years.
At the end of the day, we think excess credit build-up and depreciation of the money stock is what causes inflation on a worldwide basis, not “expectations” as revealed in highly flawed surveys. But the fact is, the Fed heads are hard core believers in expectations models, and will therefore not easily give-up the fight.
Stated differently, there is a lot of history that the Keynesian money-printers who occupy the Eccles Building blithely ignore. But, crucially, for purposes of divining where this ship of fools is headed next, the chart below is one bit of history that can’t be ignored,

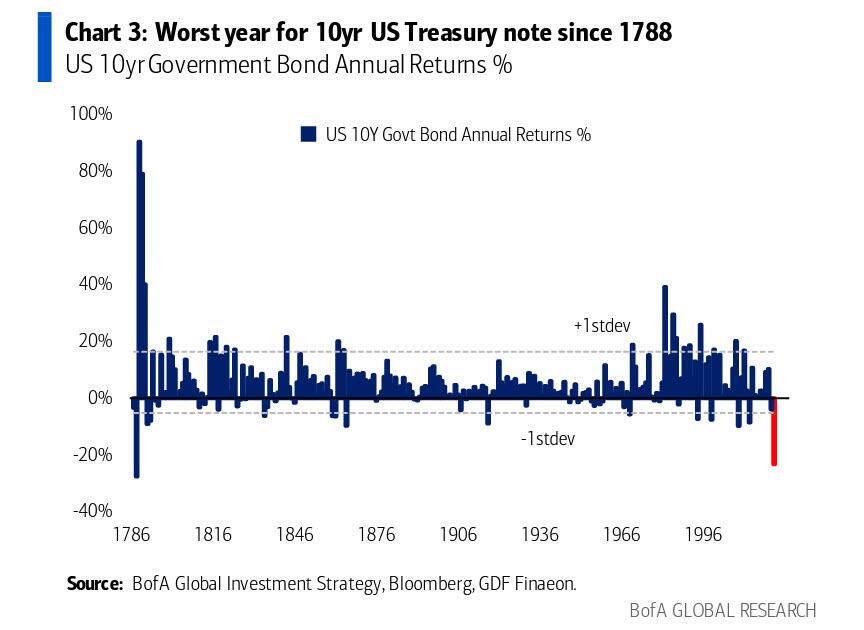
So the question recurs as to whether Fed policy will lead to serious broken financial furniture in the months and quarters ahead.
Based on the chat below, we’d say it already has.
Guest post by David Stockman from Contra Corner.
Ten hot stocks with massive upside potential
America’s #1 Pattern Trader has found a way to squeeze profits out of Wall Street’s biggest names – giving folks the chance to make 25%, 75%, even 100+% on any given trade within a few days’ time. Today he’s lined up 10 stock patterns, including the stock names, how much they could increase, and when he believes it’ll happen.