
Another debt ceiling fight is looming on the horizon and it appears the US Treasury Department is preparing for the drama. Meanwhile, rising interest rates are rapidly increasing the cost of the massive national debt.
The Treasury added $309B in new debt during October, but $260B of it was Non-Marketable debt. The Non-Marketable debt was focused on Medical Insurance Trust Fund ($166B), DoD Retirement Fund ($26B), Child Enrollment Contingency Fund ($18B), and Federal Hospital Insurance Trust Fund ($14B).
The increase in Non-Marketable debt is likely in preparation for the debt ceiling debate. The Treasury did the same thing last October, increasing Non-Marketable debt by $226B.
Note: Non-Marketable consists almost entirely of debt the government owes to itself (e.g., debt owed to Social Security or public retirement)
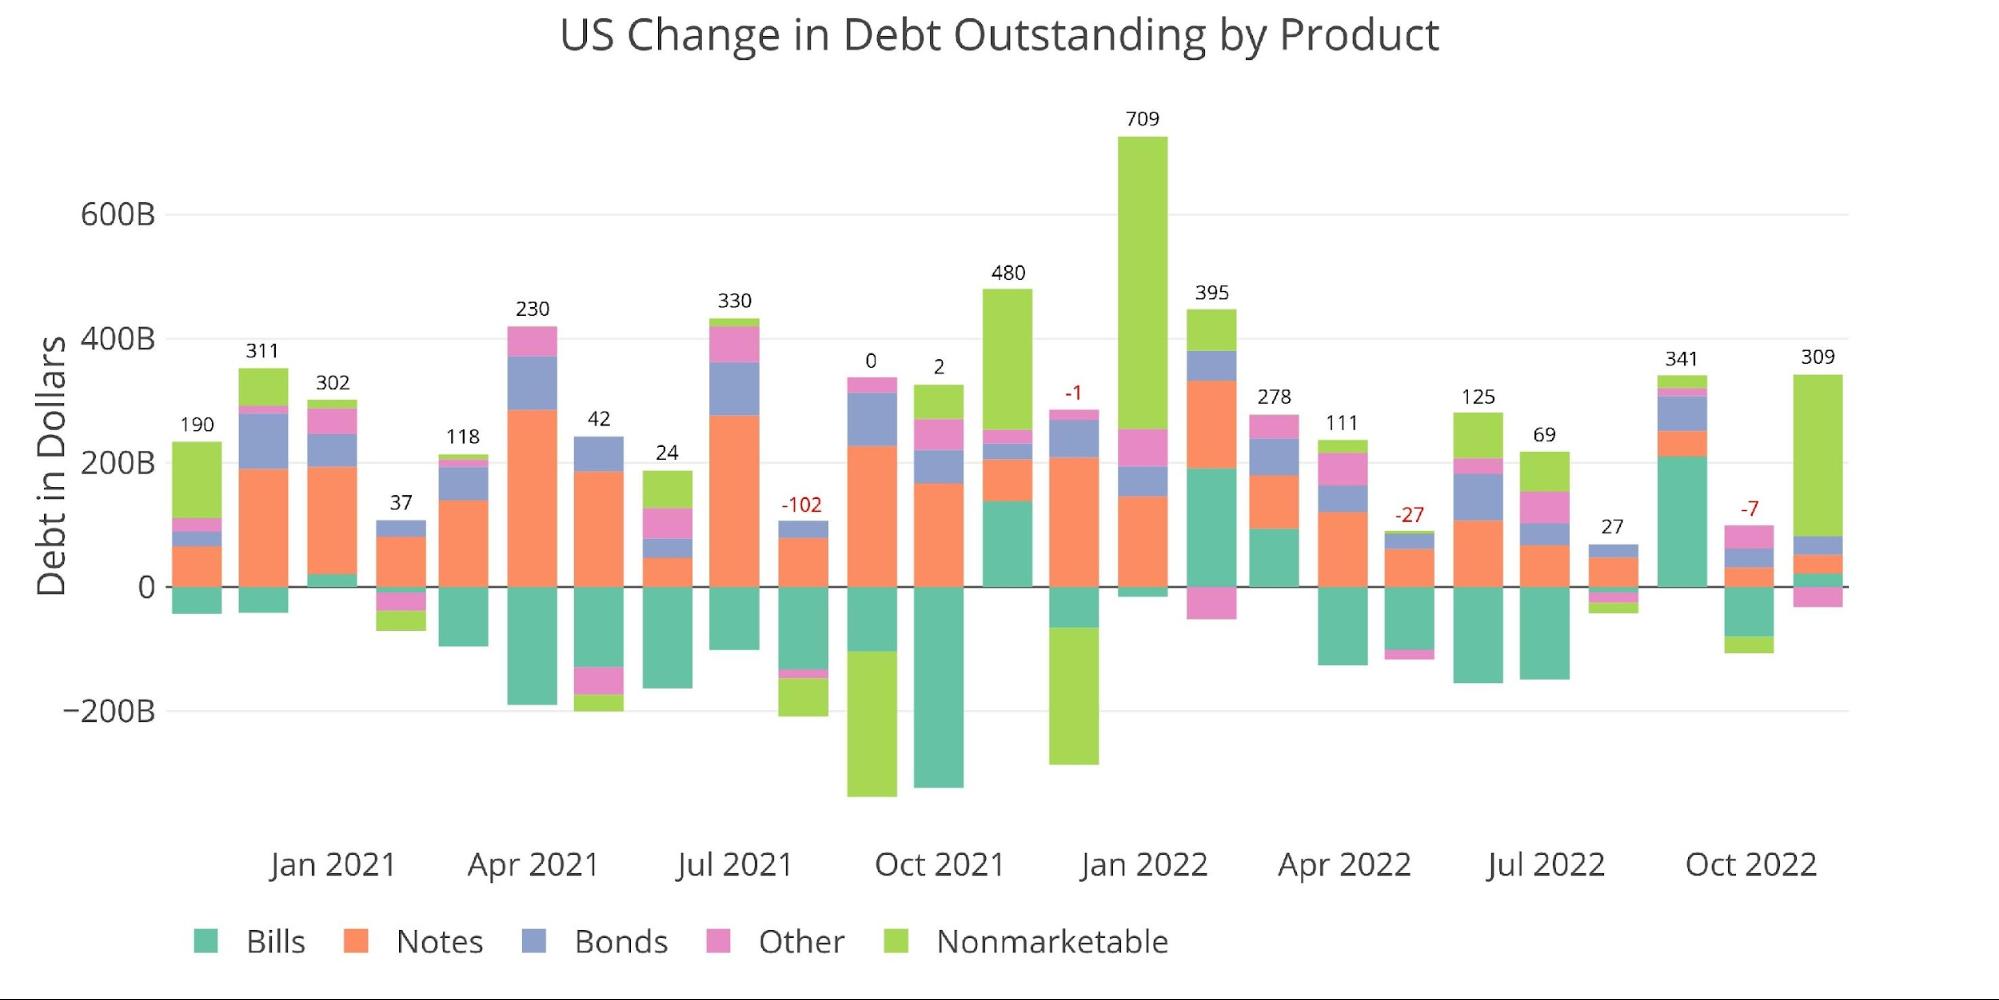
Figure: 1 Month Over Month change in Debt
YTD the Treasury has added $1.6T in new debt in 2022 despite record-high tax revenues. Before Covid, only 2010 had higher debt issuance and that was for the entire calendar year. With two months left in 2022 and $200B left before hitting the debt ceiling, there is no doubt this year would have set a record before the Covid debt splurge.
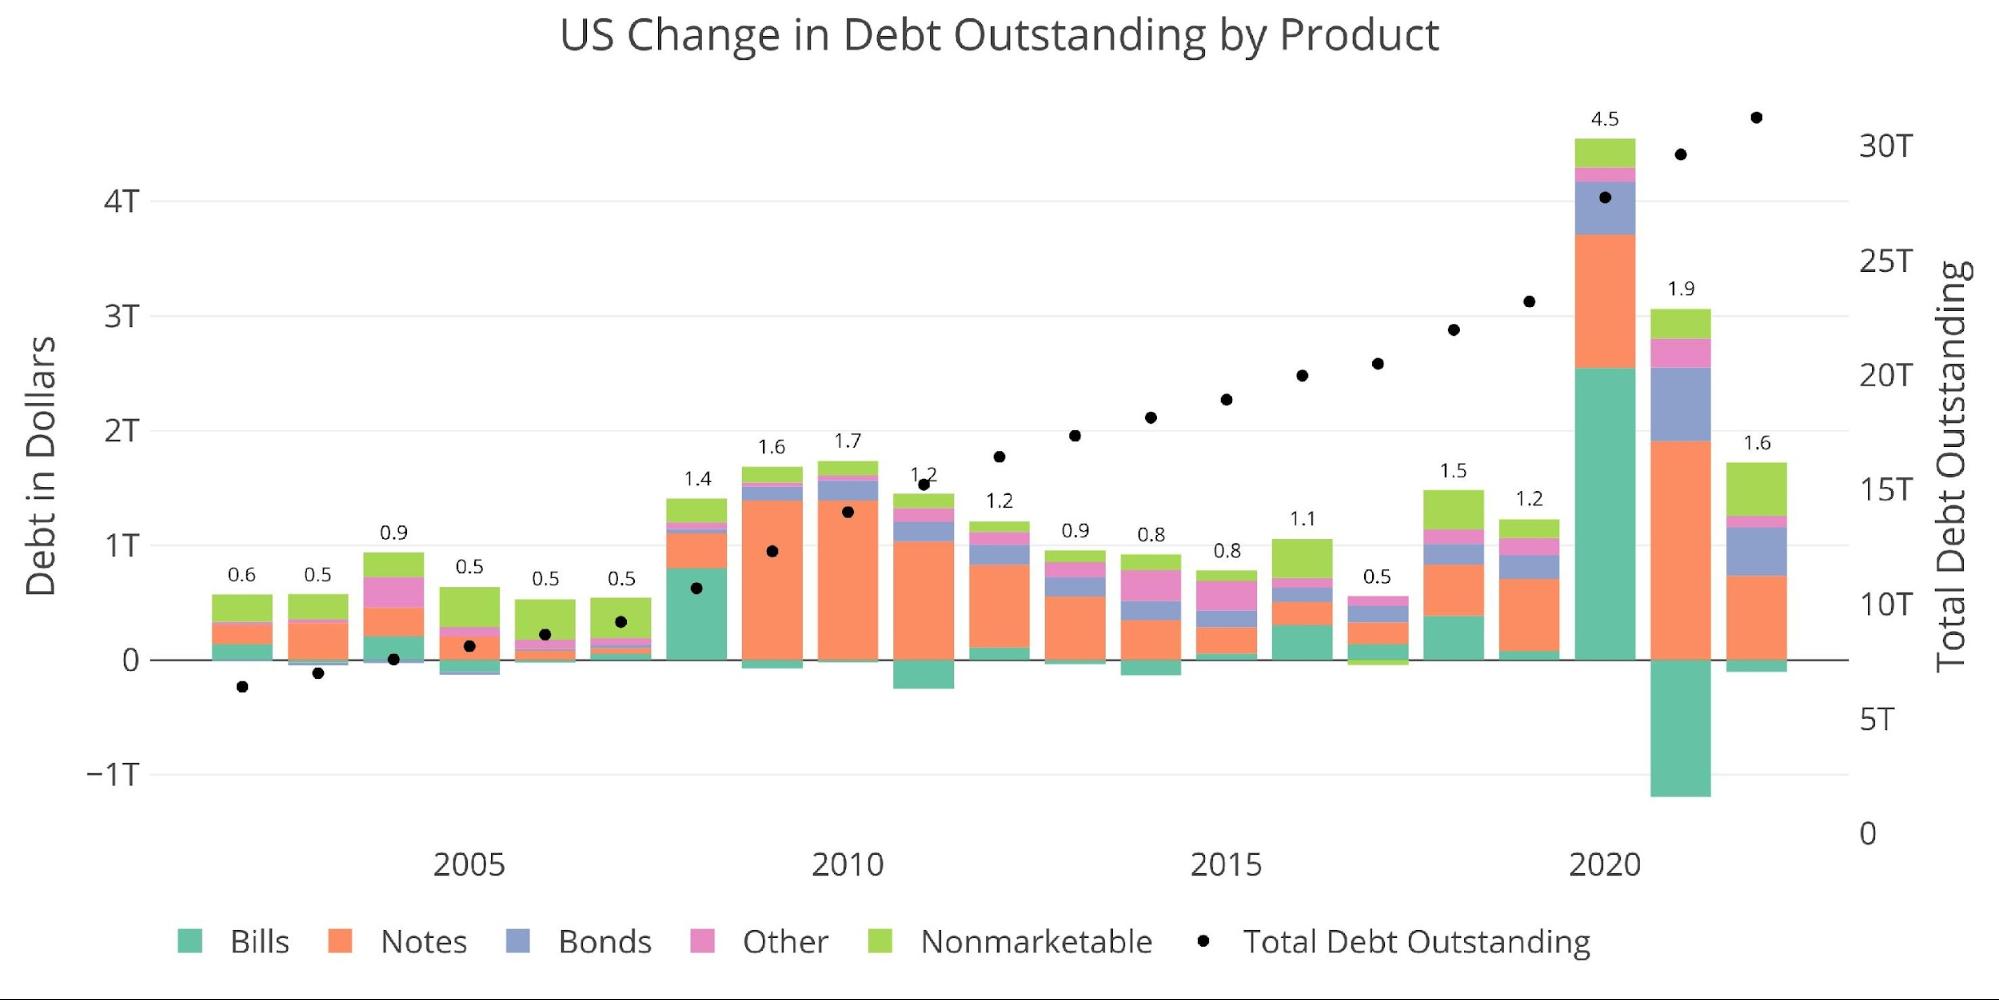
Figure: 2 Year Over Year change in Debt
The recent conversion of short-term debt to long-term debt can be seen below as the Treasury has extended the average maturity of the debt to record highs. Current average maturity has stabilized at around 6.2 years up from 5.8 years before Covid.
Despite the long maturity of the debt, the weighted average interest on the debt continues to climb rapidly, moving up a full 10bps in the last month alone from 1.72% to 1.82%, and 18bps from August.
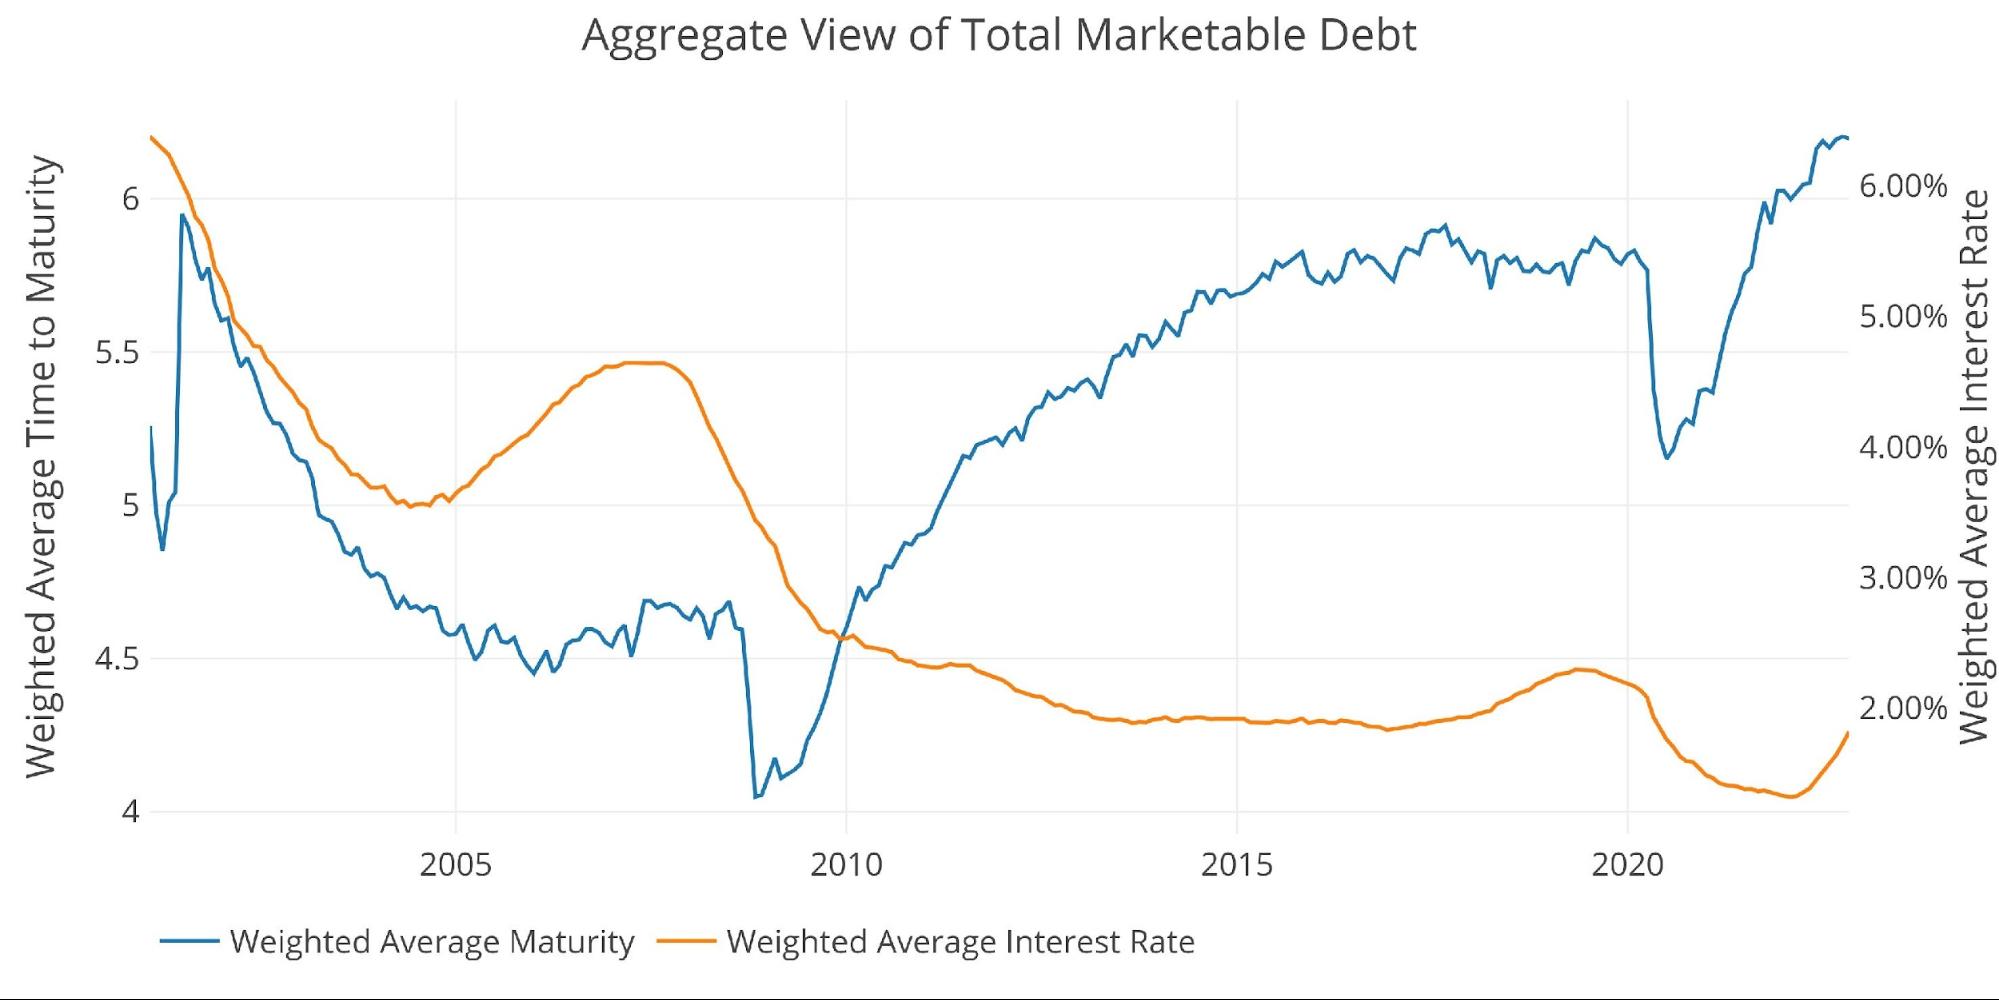
Figure: 3 Weighted Averages
The Treasury must know the Fed pivot will come, otherwise, their debt load becomes completely unsustainable!
The chart below shows the increase in interest cost so far, but it also calculates the impact on interest cost if the Fed sticks to its current plan. The chart models out interest rates at 4.5% by year-end, reaching 5.5% next September and then slowly coming back down in 2025.
The impact of higher rates is already taking its toll, but it gets significantly worse in the months ahead. The chart below estimates interest in excess of $750B by December next year and approaching $1T by the end of 2025.
Please note: for simplicity, it assumes the same (conservative) level of interest rate for all securities. It also only looks at Marketable debt and assumes $1T a year in new debt.
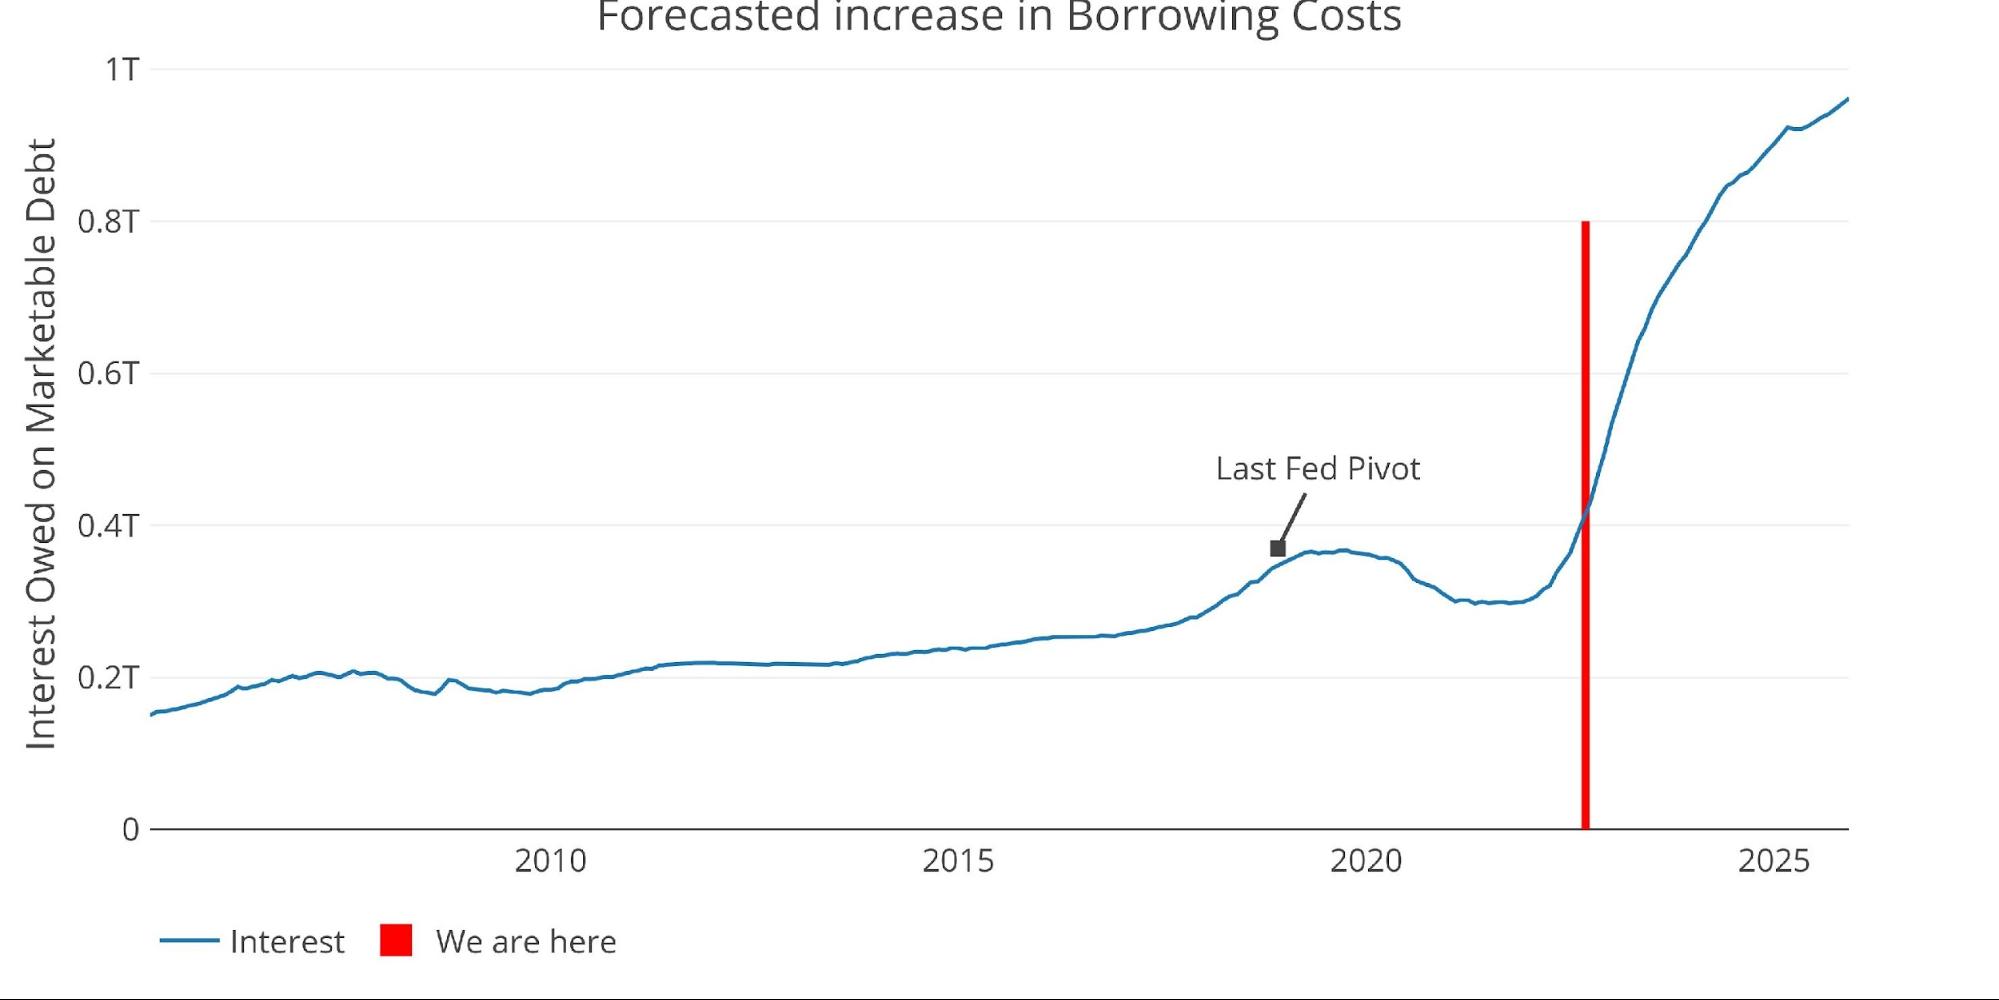
Figure: 4 Projected Net Interest Expense
The chart above shows only the interest on Marketable debt. The distribution of interest across security types is shown below. The black line overlays the actual TTM Federal interest expense as reported on the Federal deficit. The black line includes Non-Marketable interest as well.
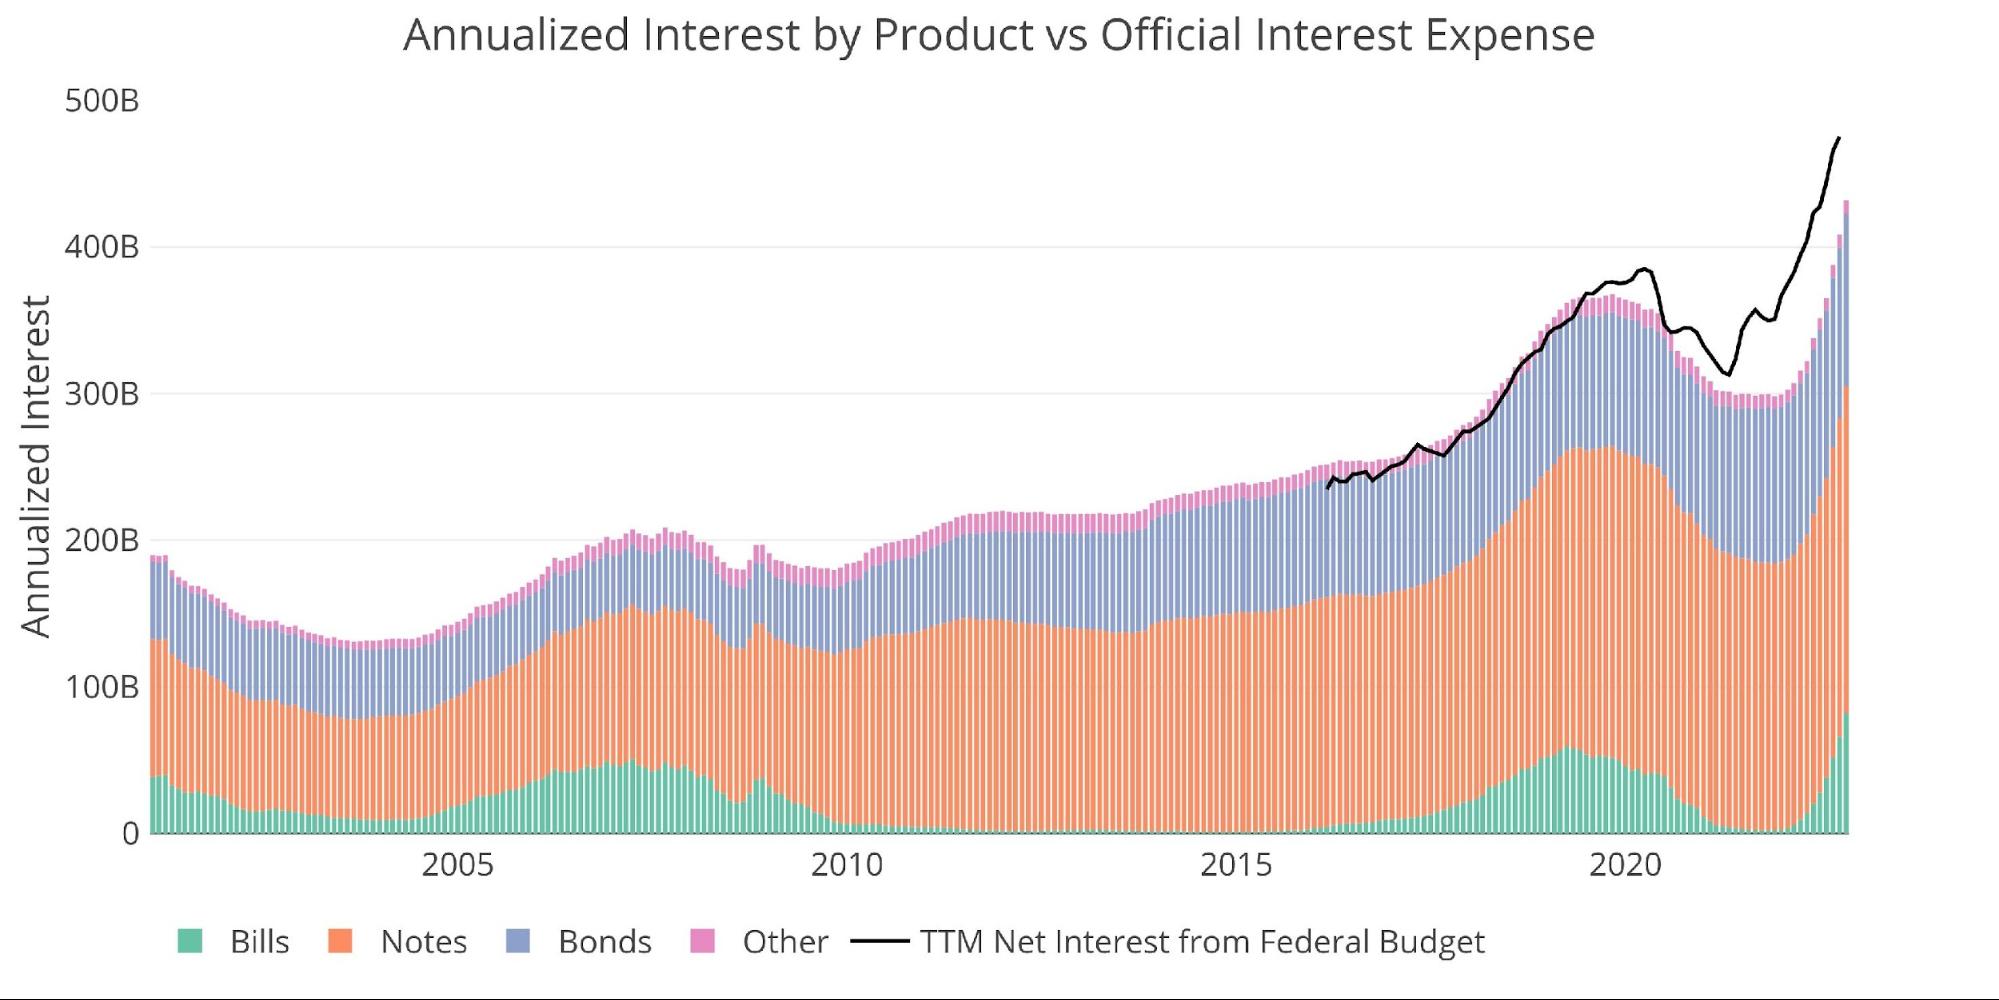
Figure: 5 Net Interest Expense
The reason annualized interest is going to surge so much is due to debt that needs to roll over in the months ahead. The chart below shows how much debt is rolling over (~$1T per month). Much of this is short-term debt, hence the steep drop-off in the light green bars, but each time the Fed raises rates, the impact on the Treasury is nearly immediate.
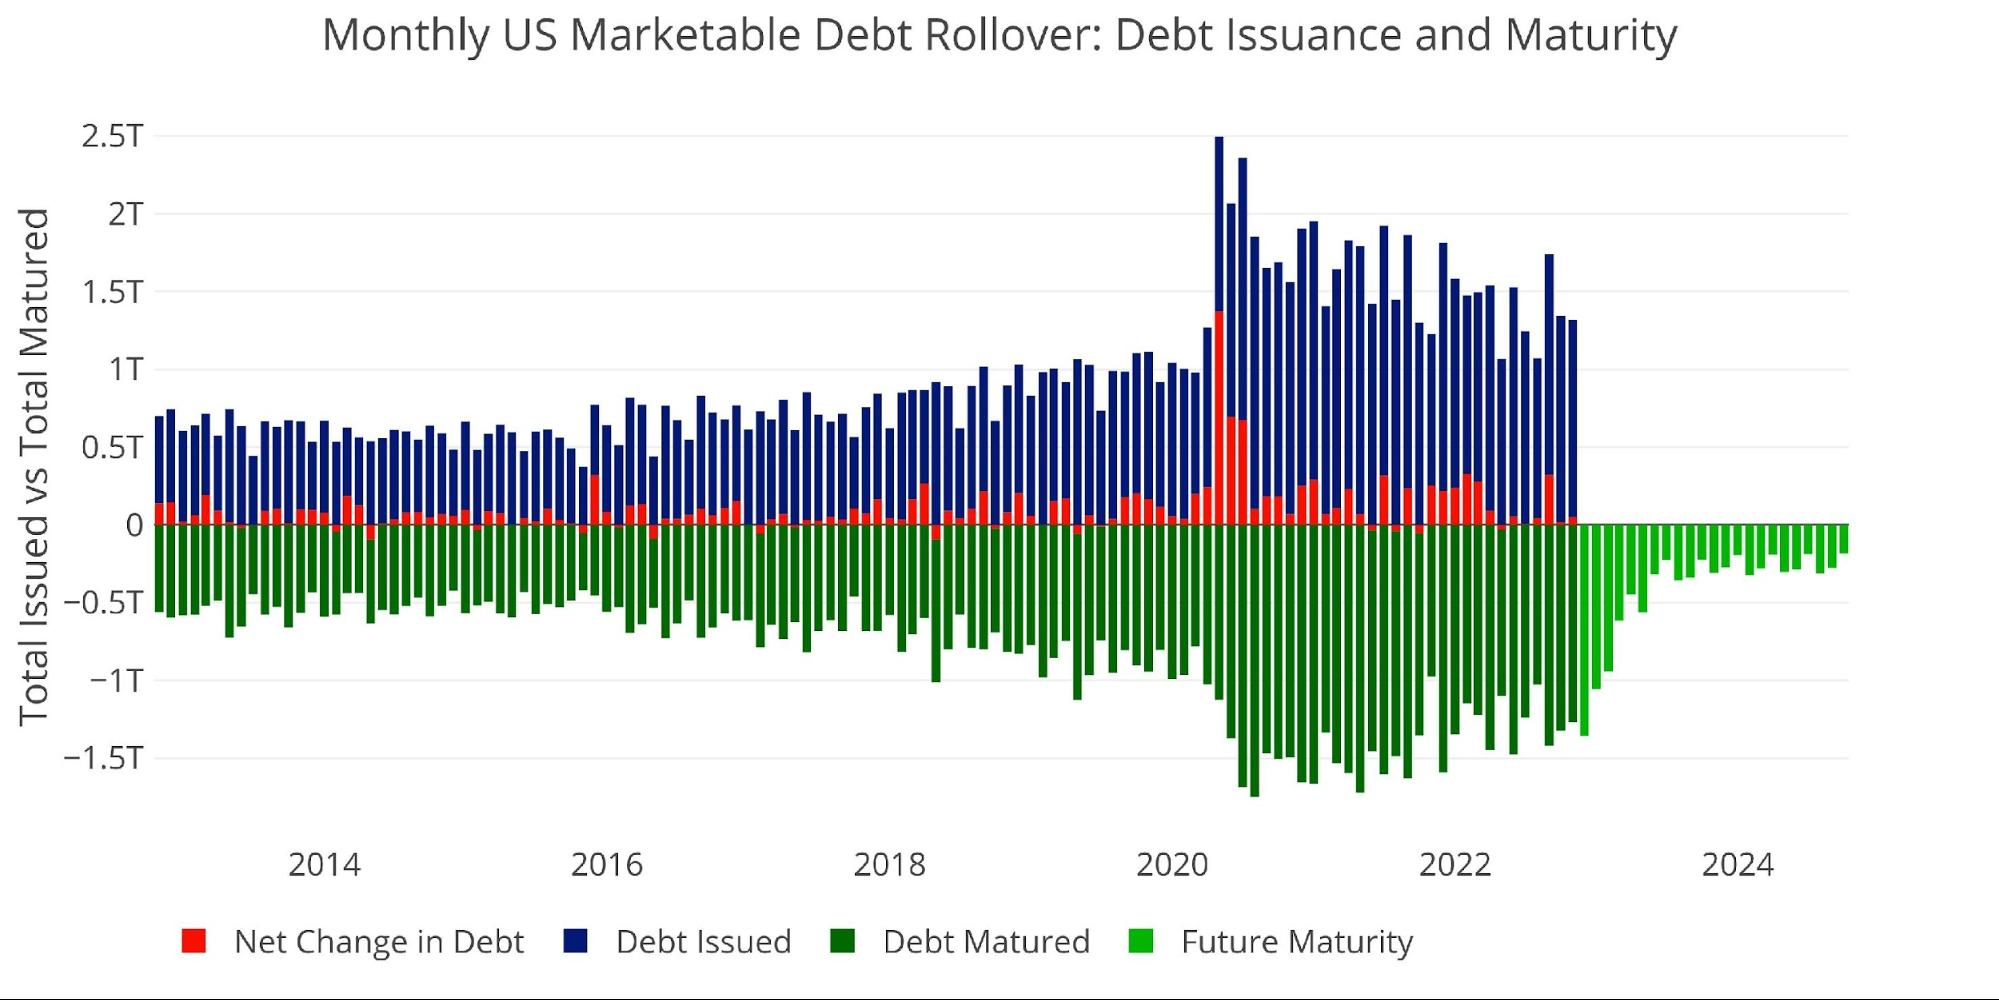
Figure: 7 Monthly Rollover
Note “Net Change in Debt” is the difference between Debt Issued and Debt Matured. This means when positive it is part of Debt Issued and when negative it represents Debt Matured
Digging into the Debt
The table below summarizes the total debt outstanding. A few key takeaways:
On a monthly basis:
-
- Every instrument increased except for a $58B decline in 3–7-year maturities
- Bills increased modestly by $21.4B vs a 12-month average of -$15.5B
On a TTM Basis:
-
- 6-12 Month Maturities declined over the year by $229B, with total bills declining $186B
-
- This is down significantly compared to the TTM in October 2021 when Treasury Bills had declined by $1.13T
-
- Over the last 12 months, total debt has increased $2.3T
- 6-12 Month Maturities declined over the year by $229B, with total bills declining $186B

Figure: 8 Recent Debt Breakdown
The Yield Curve
The higher rates from the Fed and massive debt issuance have pushed rates up significantly across the yield curve, but especially on the short side. The 2-year closed the week at 4.66% with the 10-year at 4.16%. This has made the inversion of the 10 to 2 yield at 50bps.
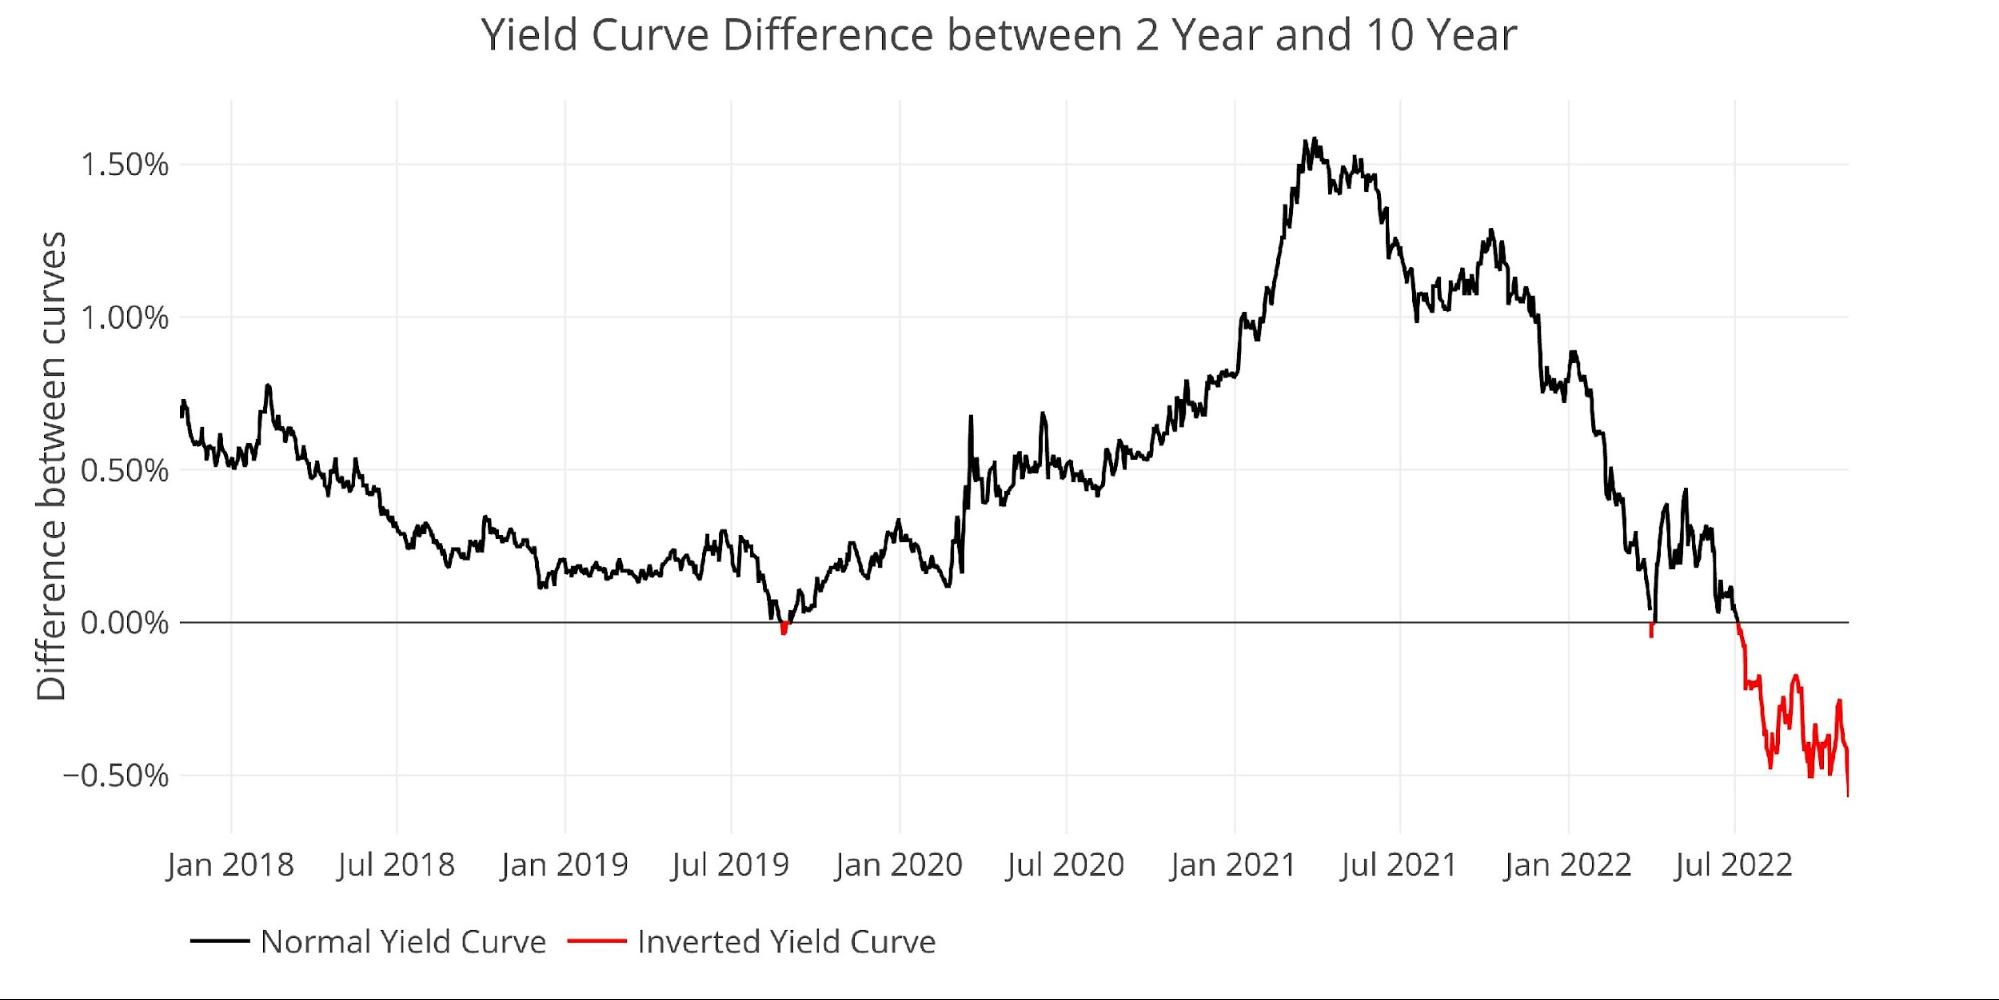
Figure: 12 Tracking Yield Curve Inversion
Despite the fact that interest rates continue to rise and liquidity in the bond market is drying up, the bid-to-cover ratio for new bond issuance has been holding steady at around 2.5.
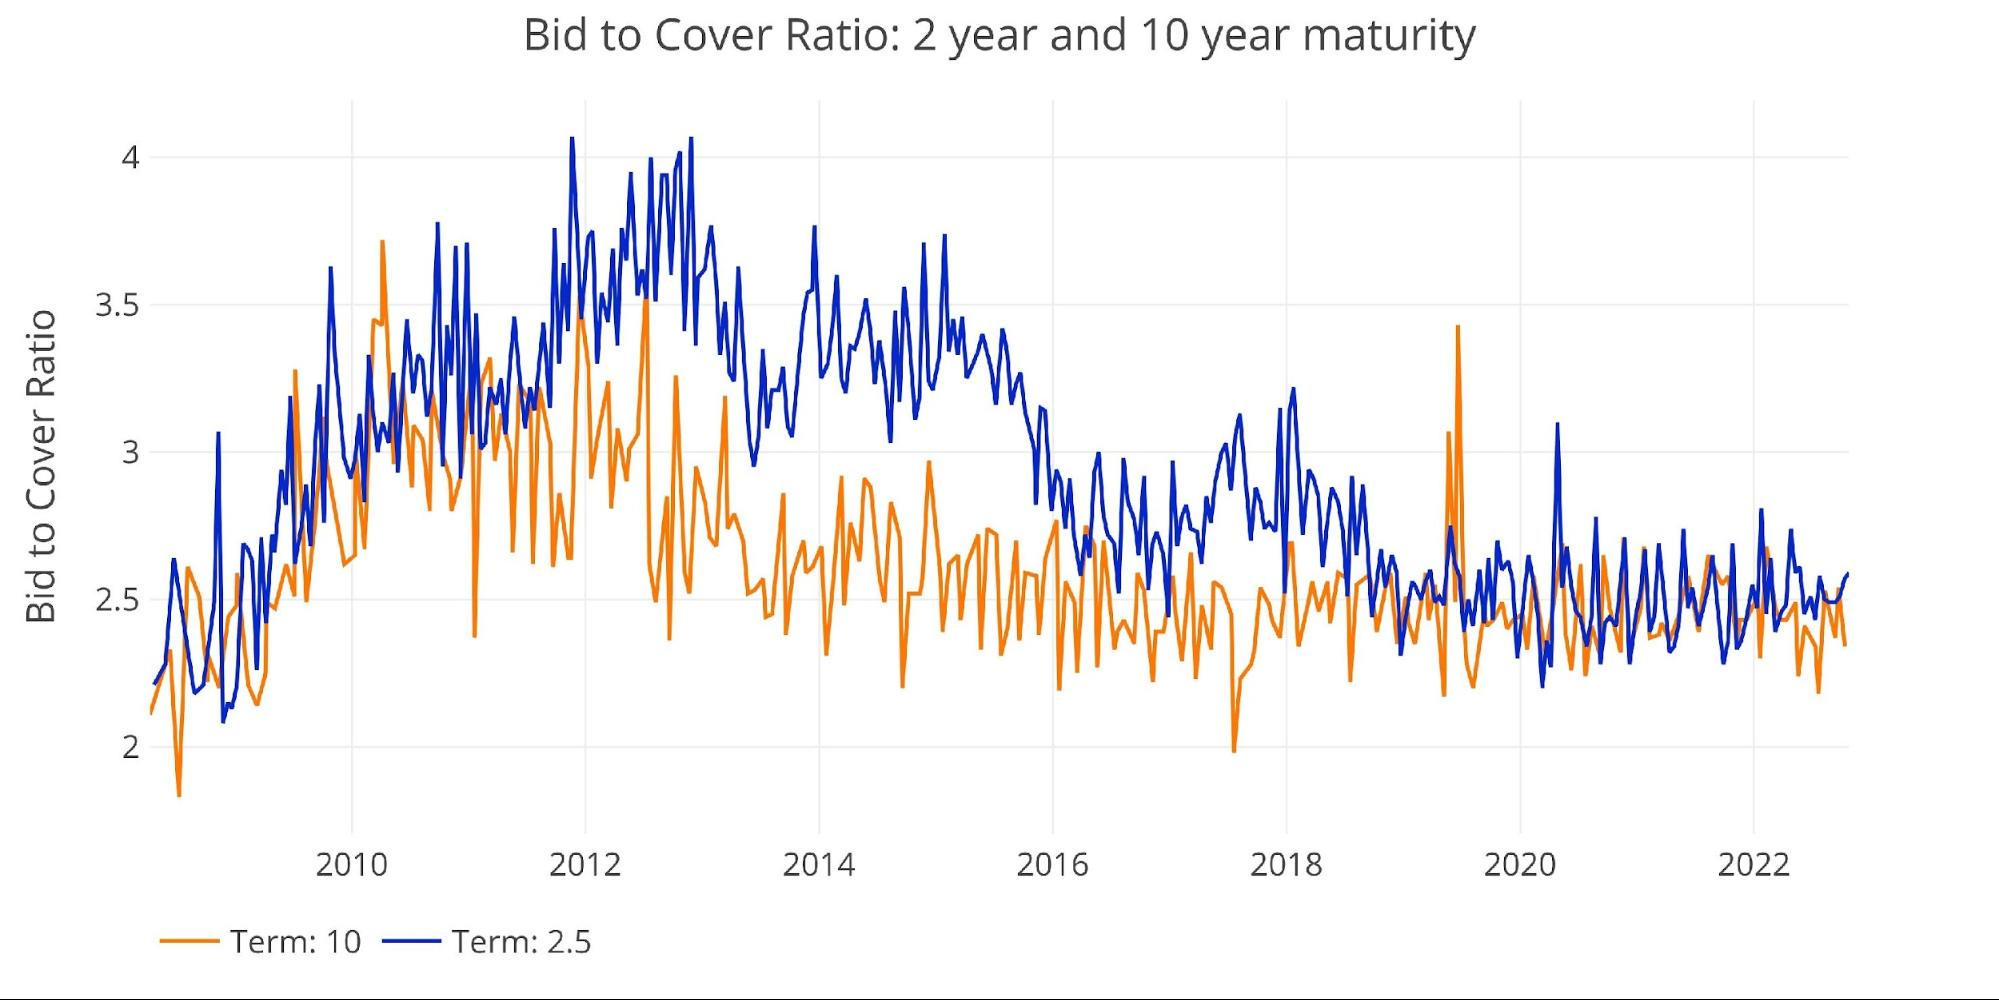
Figure: 13 2-year and 10-year bid to cover
Historical Perspective
While total debt now exceeds $31T, not all of it poses a risk to the Treasury. There is $7T+ of Non-Marketable securities which are debt instruments that cannot be resold and the government typically owes itself (e.g., Social Security).
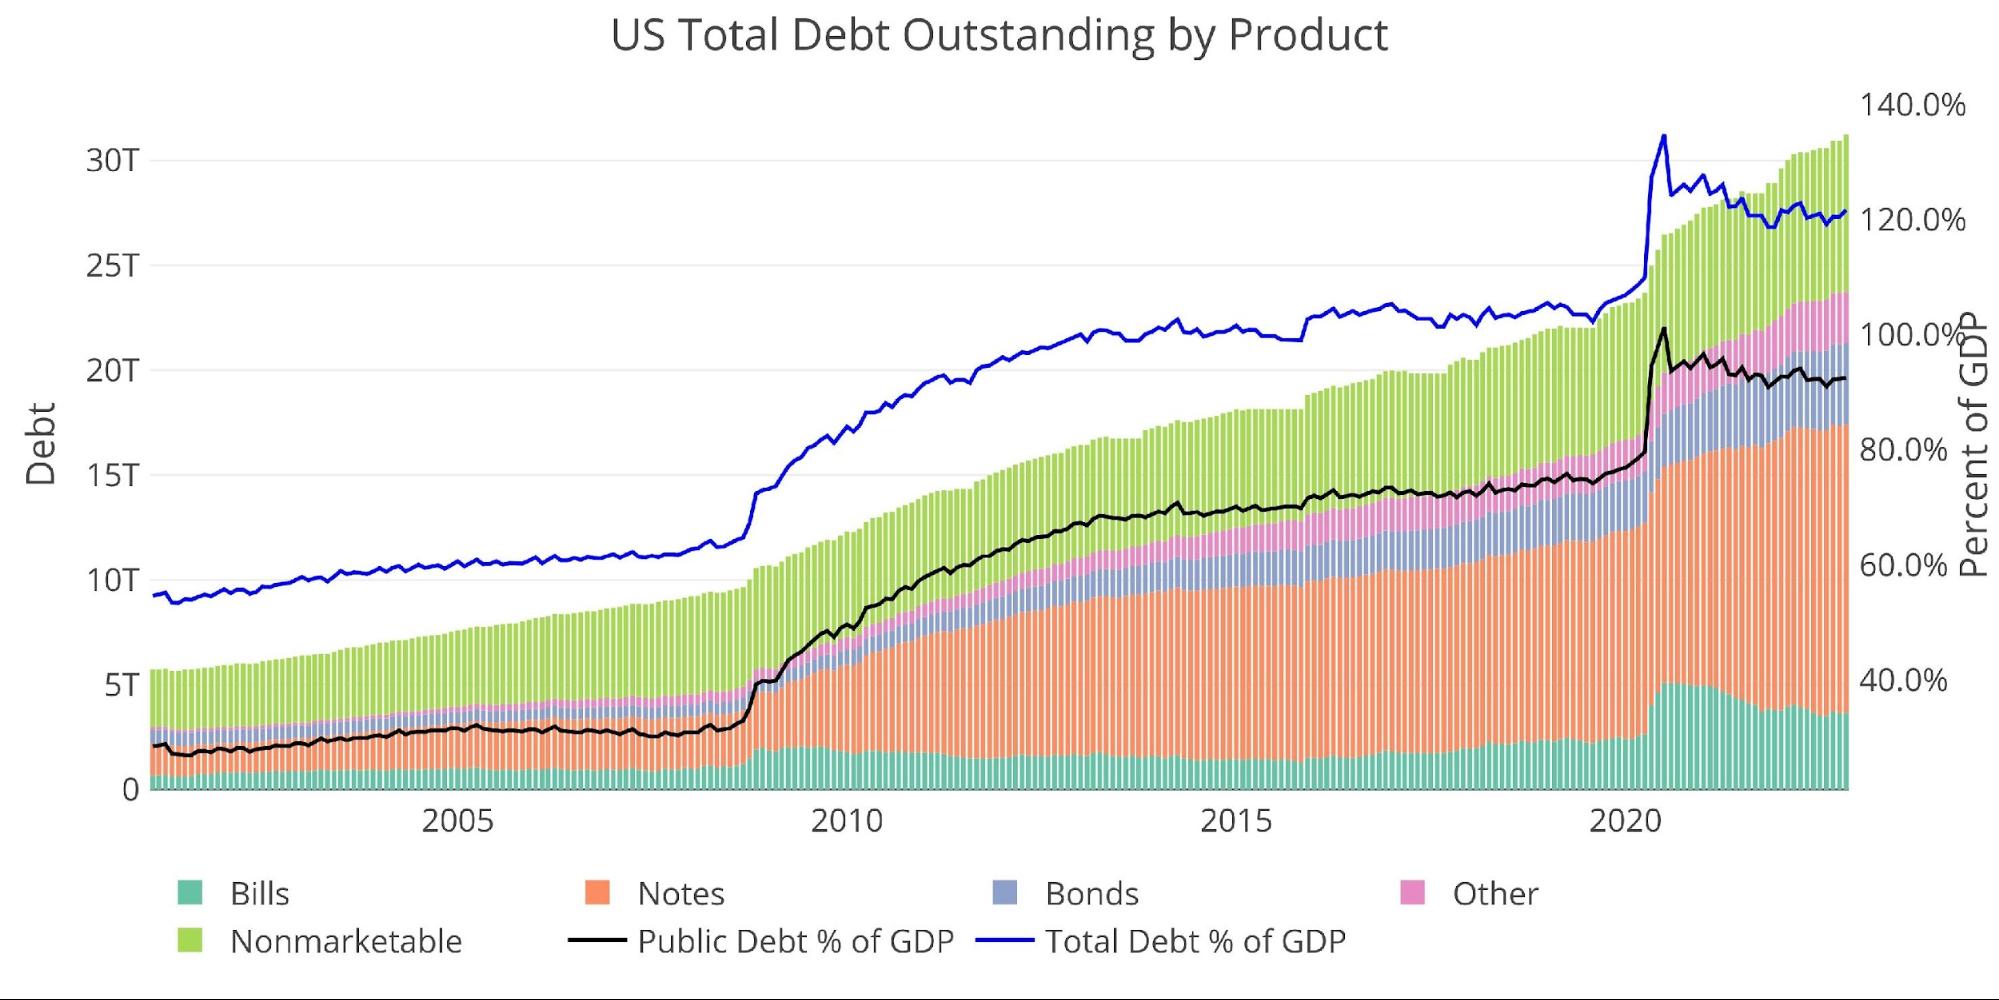
Figure: 14 Total Debt Outstanding
Unfortunately, the reprieve offered by Non-Marketable securities has been fully used up. Pre-financial crisis, non-marketable debt was more than 50% of the total. That number has fallen to 24%. In recent months, the Treasury has increased issuance of Non-Marketable but it’s not enough to make up the ground it has lost.

Figure: 15 Total Debt Outstanding
Historical Debt Issuance Analysis
The table below breaks down the trends shown above with specific numbers.
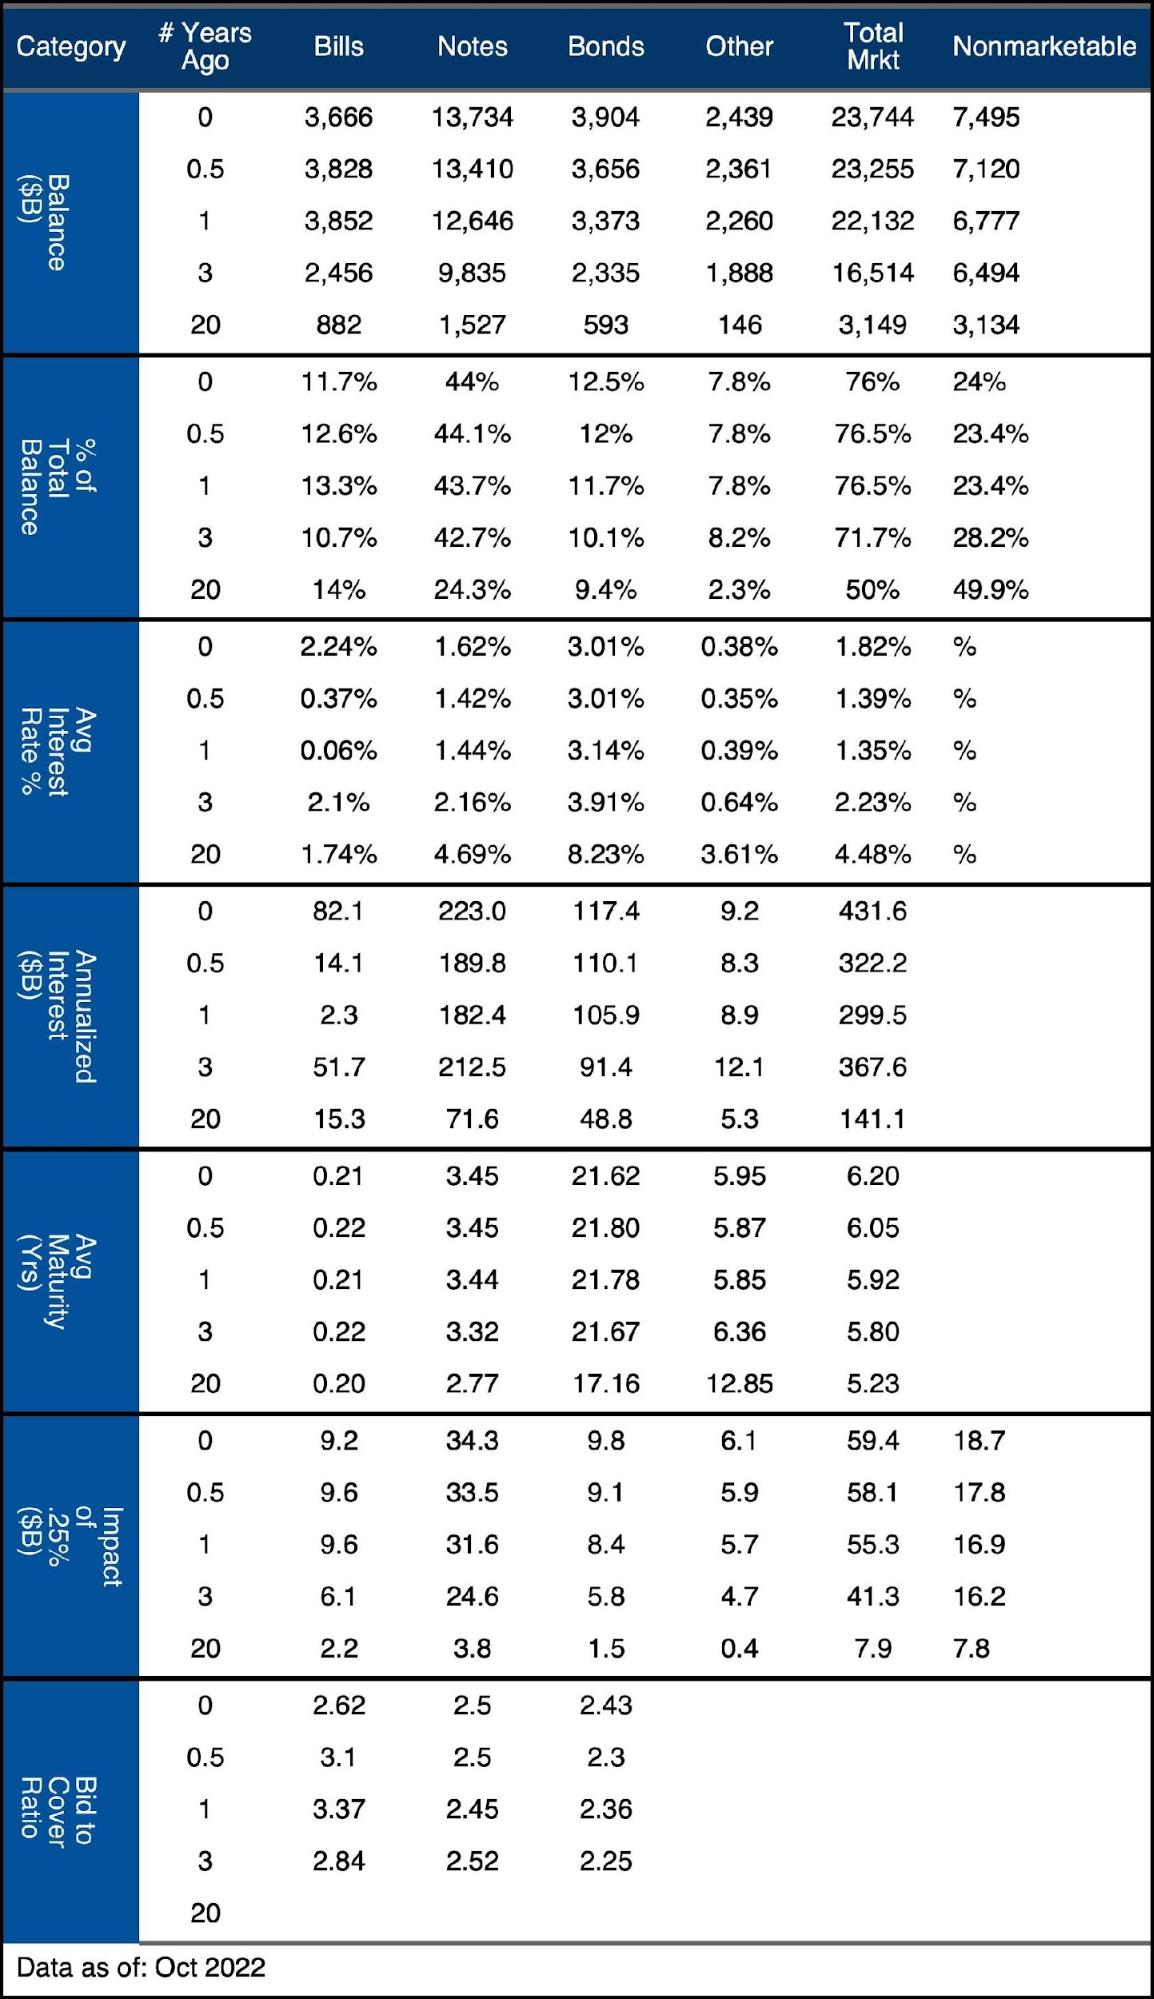
Figure: 16 Debt Details over 20 years
It can take time to digest all the data above. Below are some main takeaways:
-
- Average interest rates on Bills have increased from 0.37% to 2.24% in 6 months
-
- This has increased annualized interest from $14.1B to $82.1B
-
- The increased interest in Notes has been slower, rising 20bps in 6 months
-
- Despite the relatively small move, the increase in dollars is $40B
-
- Every .25bps hike will cost the Treasury $59.4B after it works its way through the curve.
-
- The current move up to 4% would cost the Treasury $950B in interest if the entire debt was refinanced at this level.
- 20 years ago, interest was 4.48%, so this would not be out of the ordinary
-
- Average interest rates on Bills have increased from 0.37% to 2.24% in 6 months
What it means for Gold and Silver
The Treasury cannot afford higher interest rates, especially while new debt issuance well exceeds $1T a year. The Treasury is sitting on the edge of a debt spiral. If the Fed keeps rates high for even another 12 months, interest on the debt will get out of control.
The Fed is moving so fast with interest rate hikes that it won’t even realize it has broken something until it’s far too late. Inflation remains high but every week brings the Treasury closer to the debt spiral and the economy closer to a true meltdown.
The Fed will pivot sooner rather than later because they have no other choice. At that point, gold and silver will take off. Investors got a taste of that Friday with both metals exploding higher and ending on the highs of the day. The miners led the way, increasing 10%. While the metals are not out of the woods, Friday was a preview of the moves to come.
Data Source: https://www.treasurydirect.gov/govt/reports/pd/mspd/mspd.htm
Data Updated: Monthly on fourth business day
NEW: Top 11 Stocks for 2023
He found Apple at $1.49… Oracle at $0.51… Amazon at $46.
Marketwatch called him “The Advisor Who Recommended Google Before Anyone Else.”
Now, investing legend Louis Navellier is revealing his Top 11 Stocks for 2023.