
Guest Post by David Stockman from the International Man blog:
An examination of the CPI weighting scheme sheds further light on the high, sticky inflation readings which lie in the Fed’s inflation-fighting path ahead.
Y/Y Change In Components of CPI for Food and Energy, February 2020 to June 2022
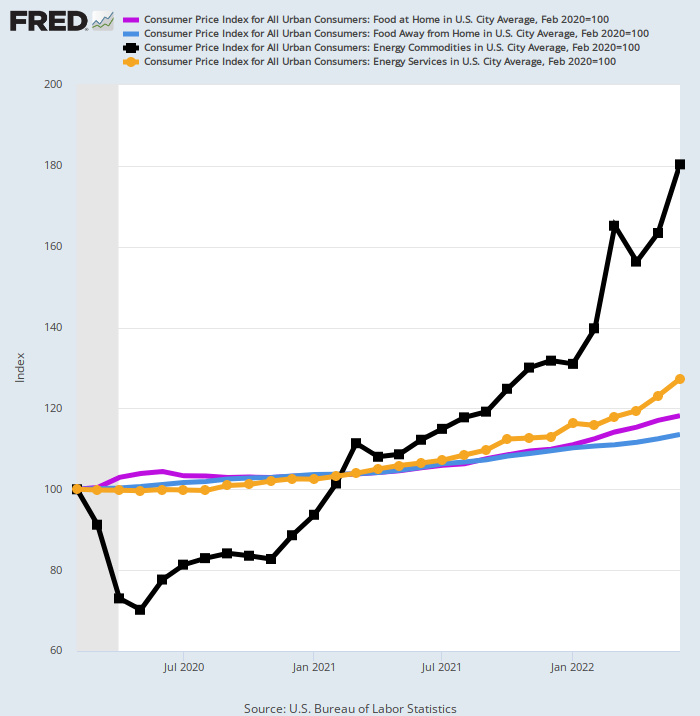
For instance, food and energy as a whole accounts for 22.1% of the CPI, but there is a clear difference between the pure commodity component of these items versus the portion in which services and domestic labor costs are mixed into the figures.
To wit, the food-at-home or grocery store portion of the food index above (purple line) is a largely commodity driven figure, and it accounts for 8.3% of the overall CPI. By contrast, the food-away-from-home index (blue line), which accounts for 5.1% of the CPI total, has a heavy services/labor component. That’s because it represents items purchased at restaurants and other labor-intensive food service establishments.
Since the pre-Covid peak in February 2020, there has been a considerable divergence between these two sub-components of the food index. The commodity-oriented portion is up at a 7.4% annual rate, while the restaurant portion is up by just 5.6%.
As to the former component, however, here’s a chart that tells you what is really happening.
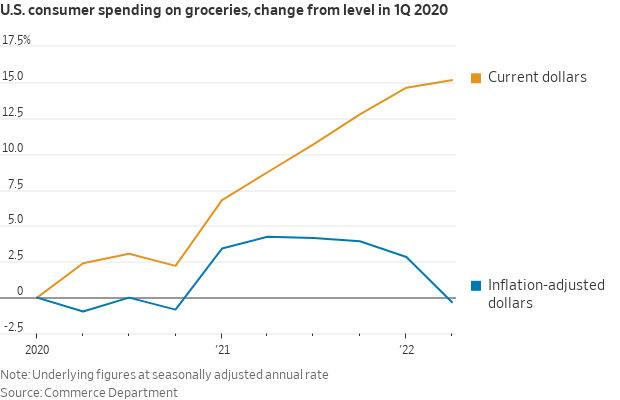
Consumers spent 15% more on groceries during Q1 2022 than they did in Q1 2020. But when you squeeze out the inflation, they ended up where they started two years earlier measured by inflation-adjusted dollars.
Needless to say, when even spending on groceries is on a treadmill, it doesn’t take much imagination to fathom where more discretionary purchases are trending. To wit, to the bargain basement bin at big box retailers which have way overstocked these items.
In any event, the gap between soaring grocery store prices and somewhat more restrained restaurant menu prices reflects mainly the lagging impact of rising wage costs in food-away-from-home prices. The latter will eventually catch-up to the grocery store commodity components and then some. After all, during the last five quarters, wage rates in the Leisure & Hospitality sector have been rising at 10-15% per annum, and these soaring costs will eventually pass through into menu prices.
In the case of energy, the bifurcation is even more extreme.
The energy commodity components (e.g. gasoline and diesel) account for 5.2% of the CPI weight and are up by 28.8% per annum since February 2020 (black line with squares). By contrast, the energy services components (e.g. utilities) account for 3.5% of the CPI weight, but are up at just 10.9% per annum rate (yellow line with circles) during the last 28 months.
Again, energy services will eventually catch up to the commodity components, once lagging regulatory and labor cost factors are passed-thru into selling prices.
In short, the underlying mechanics of even food and energy are not as simple as the surface impression might suggest. Even as gasoline and wheat costs come off the boil, still rising restaurant and energy services prices will likely off-set a significant portion of the commodity side relief.
On the other hand, the purely services components (less energy services) of the CPI account for nearly 57% of the weight in the headline index, and they have nowhere to go except higher.
That’s because 31.9% of the weight is accounted for by rent of shelter (including OER), where recent 5% Y/Y readings are drastically lagging the 15-20% gains in private sector measures of asking rents. Likewise, the 24% balance is accounted for by labor intensive services, which still have a significant catch-up momentum from rising wage rates.
These latter components include the following services and respective weights in the overall CPI:
- Medical care services: 6.8%;
- Motor vehicle lease, insurance and repair services: 4.8%;
- Education and communications services: 5.3%;
- Recreation services including video, telecoms etc: 3.1%;
- Water, sewer and household operations services: 1.9%;
- Public transportation and airfares: 1.0%;
- Other personal services, 1.4%;
- Subtotal, Services other than shelter: 24.3%;
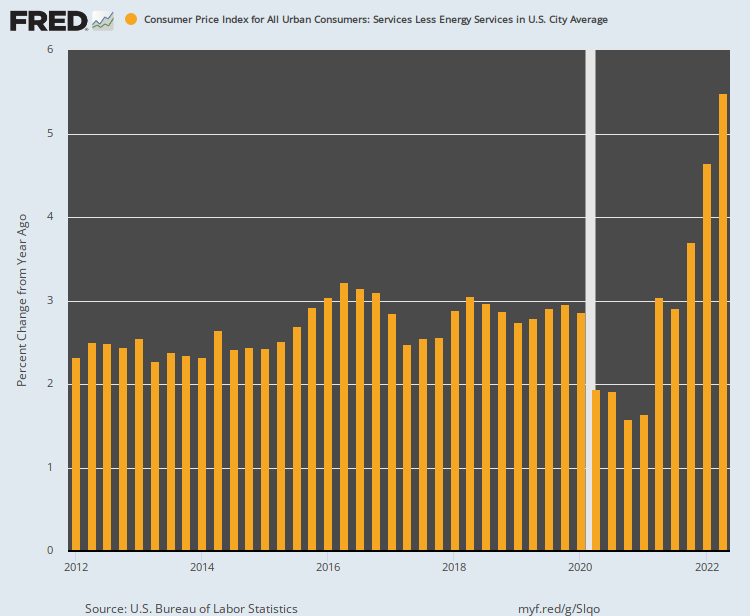
Needless to say, the recent data make clear that the relatively tame services components, which posted at 2-3% Y/Y during the 2012-2019, are now taking flight as well. The Y/Y increase for the June 2022 quarter, in fact, was 5.5% compared to just 3.0% in the June 2021 quarter.
Y/Y Change In CPI Services Less Energy Services, 2012-2022
Keynesian money-printers inflated the greatest financial bubble in history owing to the absurd belief that there wasn’t enough goods and services inflation, and that the central bank was therefore obligated to stimulate higher inflation from below.
Now, however, this illusive inflation is deeply embedded and still gathering momentum. So getting down to their 2.00% inflation target from above means only one thing: Namely, that they will blow sky high the very same financial bubbles they fostered on the way to the present monetary catastrophe.
Editor’s Note: The truth is, we’re on the cusp of an economic crisis that could eclipse anything we’ve seen before. And most people won’t be prepared for what’s coming.
Guest Post by David Stockman from the International Man blog.
Inflation is just the FIRST Blow…
A new crisis is upon us…it’s worse than inflation, worse than supply-chain woes and worse than market downturns and the ever deepening-political divide…it could be worse than ’70s inflation, the 2008 crisis and even the 2020 collapse. But in his new presentation, Dr. Weiss reveals how to protect and even grow a portfolio with seven simple investments.
To get all the details…Click here now before it’s too late.