
Guest post by Wolf Richter from WolfStreet.com:
Sellers are struggling with denial: Priced “right,” a home will sell, but “right” is where the buyers are, and they’re a lot lower.
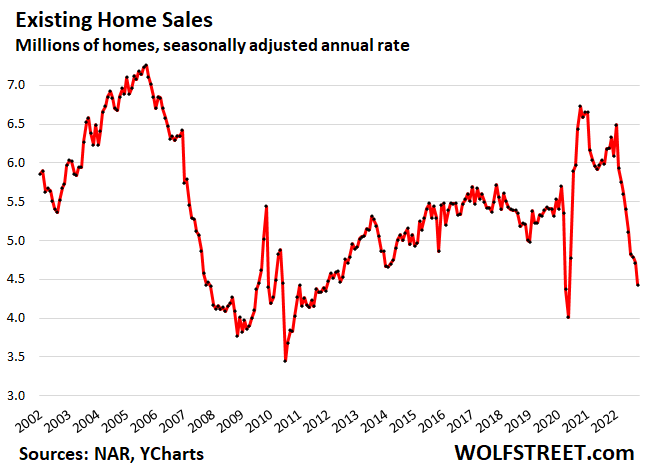
Sales of all types of previously owned homes – houses, condos, and co-ops – fell by 5.9% in October from September, the ninth month in a row of declines, to a seasonally adjusted annual rate of sales of 4.43 million homes, just a hair above the lockdown-month of April 2020, according to the National Association of Realtors. Compared to the recent free-money peak in October 2020, sales were down 34%.
Year-over-year, sales fell by 28%, the 15th month in a row of year-over-year declines. Beyond April and May 2020, this was the lowest rate of sales since December 2011 (historic data via YCharts):
Sales of single-family houses plunged by 6.4% in October from September, and by 28% year-over-year, to a seasonally adjusted annual rate of 3.95 million houses.
Sales of condos and co-ops fell by 2.0% in October from September, and by 30% year-over-year, to 480,000 seasonally adjusted annual rate.
Investors or second home buyers purchased 16% of the homes in October, down from the 17%-22% range in the spring and winter. In other words, their purchases plunged at an even higher rate than the purchases of regular buyers, as investors too are losing interest in buying at these prices.
This plunge in sales is a sign that potential sellers and buyers are in a standoff. Many potential sellers refuse to accept reality and lower their prices to where the sellers are; instead, they’re thinking, “and this too shall pass,” and they’re hoping or praying for a Fed pivot or for a miracle or whatever and don’t even put their home on the market, or pull it off the market after not getting any traffic at their aspirational asking price. And buyers have lost interest at the current prices.
Homes that are priced right – meaning priced down where the buyers are – are selling. But sellers don’t like to go there. And we see that in the active listings too. But there is some price-cutting going on, as more sellers figure this out.
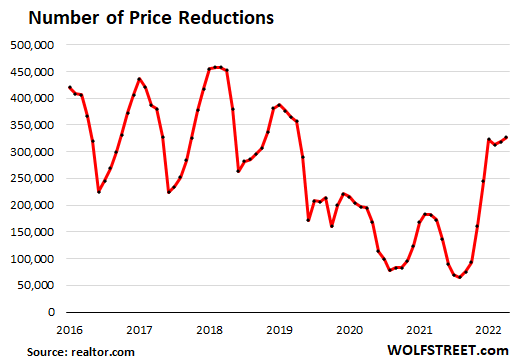
Price reductions: In October, the number of homes listed with price reductions rose to 327,184 homes, the highest since October 2019, and just a tad below it (data via realtor.com).
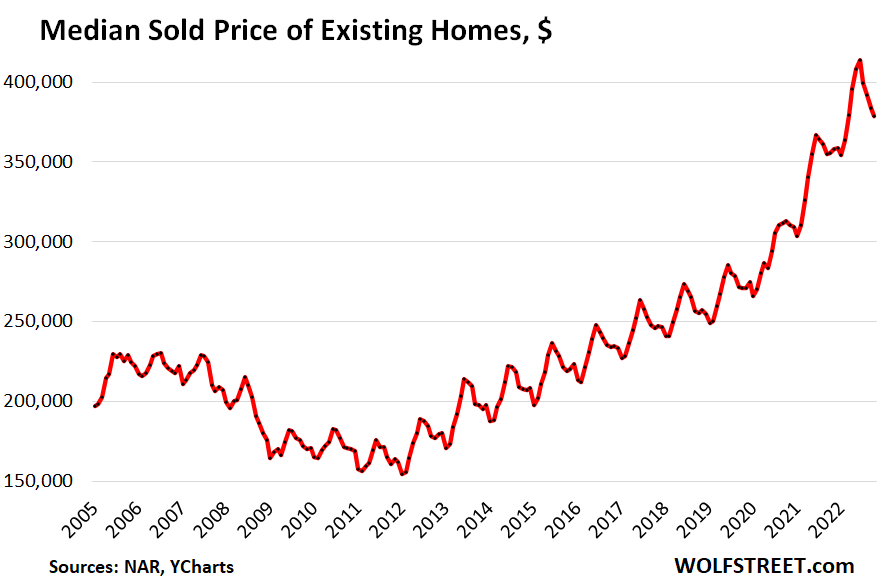
The median price of all types of homes whose sales closed in October fell for the fourth month in a row, and is now down 8.4% from the peak in June.
This whittled down the year-over-year gain further, to 6.6%, down from 8.0% in September, and down from year-over-year gains in the 20% to 25% range at peak frenzy last year, indicating that seasonality is only responsible for a portion of the price drop, and the rest of the price drop is some sellers getting more realistic (historic data via YCharts):
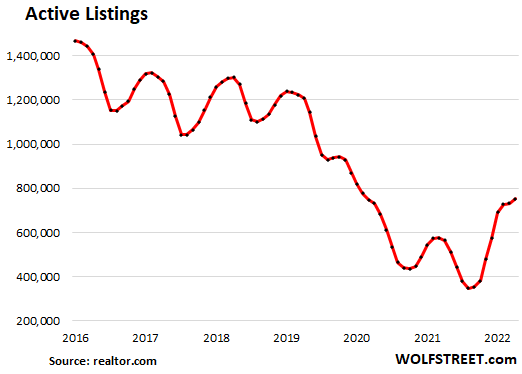
Active listings (total inventory for sale minus the properties with pending sales) rose to 754,000 homes in October, up by 33% from a year ago, and the highest since August 2020. They remain relatively low, another sign that potential sellers are still hoping for a Fed pivot or a miracle and don’t put their vacant home on the market or pull it off the market after a short while (data via realtor.com).
Days supply of total inventory increased to 3.3 months of sales, the highest since June 2020.
Sales by region: Sales plunged in all regions, but plunged by the most in the West:
- Northeast: -6.6% mom; -23.0% yoy.
- Midwest: -5.3% mom; -25.5% yoy.
- South: -4.8% mom; -27.2% yoy.
- West: -9.1% mom; -37.5% yoy.
As mortgage rates jumped to the normal-ish range of the pre-money-printing era:
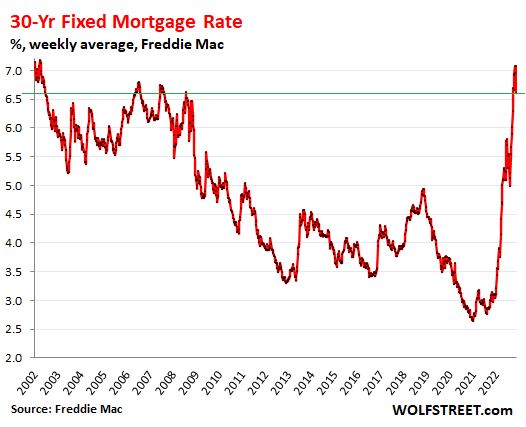
Guest post by Wolf Richter from WolfStreet.com.
How to Own Tens of $Billions in Gold for Just US$1 Per Share
A brand new gold bull market has arrived as nervous investors continue to flock to the safety of the yellow metal.
Yet, the biggest gains won’t be in gold…they’ll be in select gold stocks with proven ounces in the ground.
This soon-to-be-known gold company provides investors with exposure to over 30 million ounces of gold…worth tens of $Billions…at a ridiculously low US$1 per share.
