
The Fed is going to have a field day with its rate hikes later this month. Prices of services, housing, food, fuel all spiked in Friday’s CPI report. With that, the dollar’s purchasing power went WHOOSH and J. Powell went “OOSH$#!”
by Wolf Richter on Wolf Street:
Raging inflation. The costs of services continued to spike in May, which has been the thing to watch for months because it’s where consumers spend most of their money, and it’s unrelated to “transitory” spikes in commodities. This is where inflation is getting entrenched and will be hard and painful to dislodge, and it’s now front and center. Costs of gasoline and natural gas blew out; the cost of food spiked by over 10%, while inflation in used vehicles resumed their spike, after three months of declines, and new vehicle prices continued to surge.
I said a few days ago, while observing the reinvigorated spike in gasoline and diesel prices, “Inflation not in the mood of peaking yet,” and that’s what we’re seeing, but for reasons beyond gasoline.
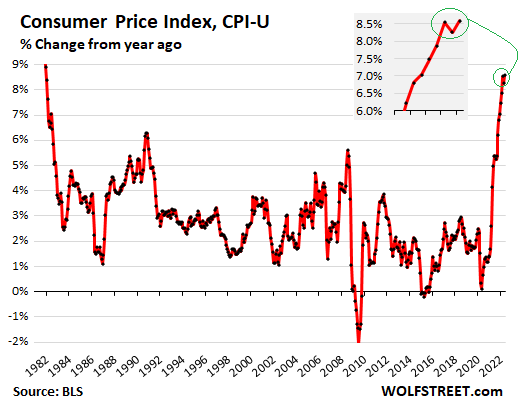
The headline Consumer Price Index (CPI-U), released today by the Bureau of Labor Statistics, spiked on a month-to-month basis by 1.0% in May, the worst red-hot month-to-month spike in this entire red-hot inflation cycle, with no sign of peaking. Year-over-year, CPI spiked by 8.6%, the worst since 1981. And the Fed is going to have a field day with its rate hikes:
CPI-W, which tracks inflation for “all urban wage earners & clerical workers,” and whose third-quarter average is used to adjust the COLAs for Social Security in the following year, spiked by 9.3% in May.
In the basket of goods and services that is used for CPI, there are always some items that decline or remain stable, and other items that move higher, and they all have different weights in the CPI, with housing costs accounting for about one-third of CPI, and some items may go down one month, but others may surge, and the whole thing gets compared to levels a year ago, which throws the “base effect” into the mix, and so the year-over-year CPI rates are never a straight line, but move up and down and offer many instances of false hopes. But in this inflation cycle, we had a nearly straight line higher, interrupted only by two events of false hopes: this April and the summer of 2021.
For people who spend all their money on necessities – such as rent, food, gasoline, utilities, and health insurance – inflation is a lot worse than CPI, because this basket of goods and services tracks more closely the spending by the big spenders.
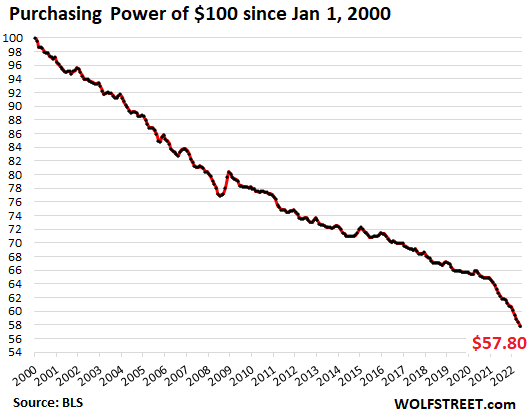
Purchasing Power of the dollar goes WHOOSH.
The CPI tracks the loss of the purchasing power of the consumer’s dollar, and thereby the purchasing power of labor. In May, the purchasing power of $100 in January 2000 dropped to $57.80, and this is why this raging inflation has put Americans in a very sour mood:
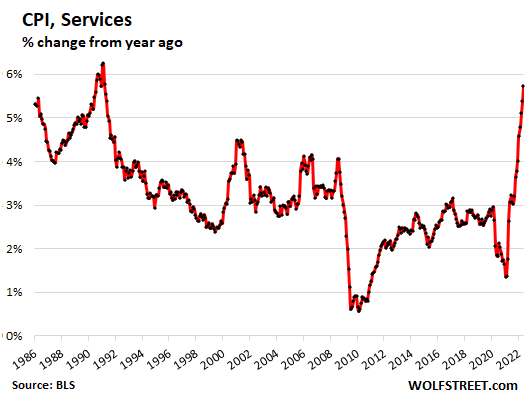
CPI inflation in services spikes.
The CPI for services spiked by 0.8% from the prior month (close to 10% annual rate!), and by 5.7% from a year ago, the worst since 1990. And this is just relentless — and it is why the Fed is going to have a field day with its rate hikes:
Services include housing costs, which we’ll get to in detail because that’s its own disaster in the making. And it includes other items, most prominently these (year-to-year % change):
- Health insurance: +13.8%
- Airline fares, summer special: +37.8%
- Lodging in hotels and motels, summer special: +22.2%
- Delivery services: +16.4%
- Laundry and dry-cleaning services: +10.1%
- Car and truck rental spiked month-to-month by 1.7%, but year-over-year was down from the crazy spike last year: -0.4%
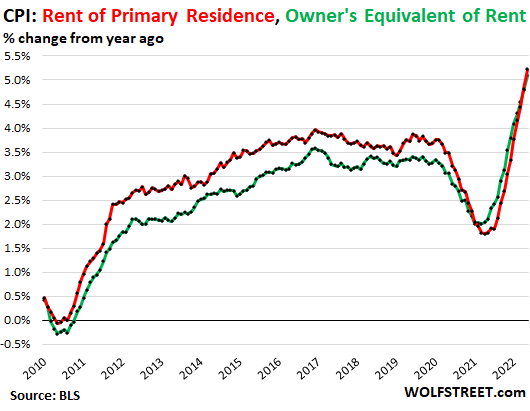
The CPI for housing spikes, but with a lag.
The CPI for “shelter” accounts for 32.4% of total CPI and is the largest component. It’s designed to reflect housing costs as a service (not as an asset to be purchased). The largest components within this basket are “Rent of primary residence” (7.3% of total CPI) and “Owner’s equivalent rent of residence” (23.8% of total CPI).
“Rent of primary residence” jumped by 0.6% for the month and by 5.2% year-over-year (red in the chart below). It measures what a very large panel of tenants reported as the change in their actual rent payments over time, including in rent-controlled apartments.
“Owner’s equivalent rent of residences” jumped by 0.6% for the month and by 5.1% year-over-year (green line). It measures the costs of homeownership as a service, based on what a very large panel of homeowners report that their home would rent for.
Both measures are still below the overall CPI and therefor are still holding down CPI, but each month, they’re holding it down less than in the prior month, and they will come into full bloom later this year:
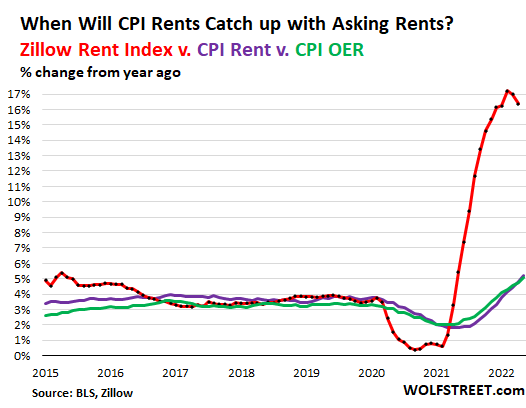
CPI for housing costs v. Asking Rents v. Home Prices.
CPI rent measures track rent increases that are actually experienced by tenants that have been renting these apartments and houses for a while.
“Asking rents” track advertised rents of vacant apartments and houses listed for rent. They’re a measure of what landlords want for their apartments and houses that they have listed for rent. They do not reflect actual rents paid by tenants. But they show where the market is.
The Zillow Rent Index has shot up, starting in the summer of 2021 as it was coming out of the Pandemic trough. On a year-over-year basis, it jumped 16.4% in May. The year-over-year increase is down slightly from prior months. But on a month-to-month basis, the index jumped 1.0% in April, the latest data available, up from the 0.8% increase in March.
But it takes a while for asking rents to become actual rents that tenants are paying, and it takes a while longer for these higher rents to get picked up by the CPI panel of tenants when their lease expires and when they get actual rent increases.
You can see this lag in the chart below. The “rent of primary residence” (purple) and the “owner’s equivalent rent” (green) are in the process of catching up with the Zillow Rent Index (red line), and will continue to rise, even if the asking rents, tracked by Zillow, back off over the next 12 months. In other words, the CPI housing components that account for nearly one-third of CPI will fuel CPI inflation well into 2023 (my discussion of this phenomenon):
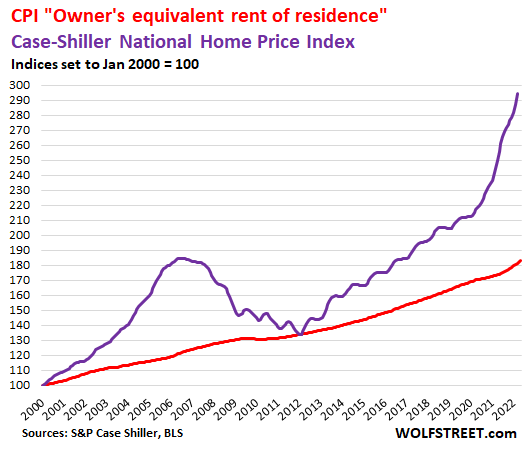
The cost of buying a house spiked by 20.6% year-over-year in the January through March period, according to the latest Case-Shiller Home Price Index (purple line below). I document this raging mania in The Most Splendid Housing Bubbles in America.
But the CPI doesn’t measure the cost of purchasing a house as an asset; it attempts to measure the cost of the service that a home provides – shelter – via its “owner’s equivalent or rent” (red). Both indices are set to 100 for January 2000:
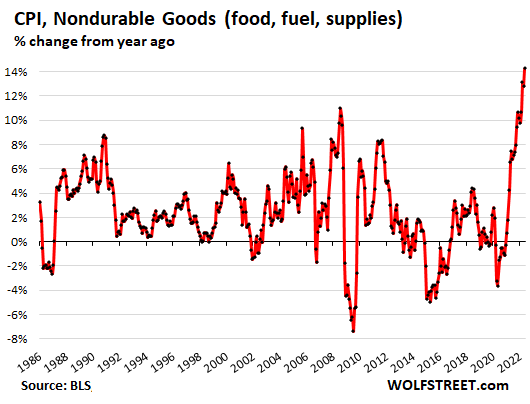
CPI, nondurable goods.
The CPI for nondurable goods is dominated by food, gasoline, utilities, and household supplies. After having risen only 0.3% month-to-month in April for another moment of false hopes, it spiked by 2.1% in May from April, and by 14.3% year-over-year, the worst spike since April 1980:
“Food at home” CPI spiked by 1.2% for the month and by 10.1% year-over-year. In some categories, such as beef, price increases, while still red hot, backed off a tad. In other categories, such as poultry and fish, price increases worsened.
Major categories, and % change from year ago:
- Cereals and cereal products: 12.8%
- Beef and veal: 10.2%
- Pork: 13.3%
- Poultry: 16.6%
- Fish and seafood: 12.2%
- Eggs: 32.2%
- Dairy and related products: 11.8%
- Fresh fruits: 8.5%
- Fresh vegetables: 6.4%
- Coffee: 15.3%
- Fats and oils: 16.9%
- Baby food: 12.9%
“Food away from home” CPI – any food eaten outside the home, such as food from vending machines, cafeterias, sandwich shops, and restaurants – jumped by 0.7% for the month and by 7.4% year-over-year, the most since November 1981.
The Energy CPI, after falling in April from March for that beautiful moment of false hope, re-spiked in May on the spike gasoline prices, and on the spike in natural gas prices (the Energy CPI accounts for 8.3% of overall CPI):
- Total Energy CPI: +3.9% for the month, +34.6% year-over-year
- Gasoline: +4.1% for the month, +48.7% year-over-year.
- Utility natural gas to the home: +8.0% for the month, +30.2% year-over-year.
- Electricity service: +1.3% for the month, +12.0% year-over-year.
The CPI for durable goods.
This is a mixed bag. It includes new vehicles, used vehicles, consumer electronics, furniture, appliances, etc. Month-to-month, CPI for durable goods ticked up 0.1% in May, after having been roughly flat in April, and having declined in March.
Year-over-year, durable goods spiked by 11.4%, but this was way down from the 18.7% spike in February:
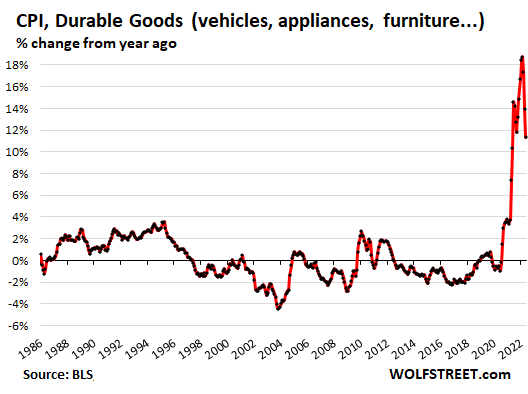
The false-hope peak inflation. The month-to-month dip in durable goods CPI in March and the flat spot in April (along with the drop in gasoline prices in April) had given rise to the false-hope proclamations that inflation had “peaked.” What we can say is that inflation in durable goods may have peaked from the crazy spikes we saw last year and early this year, and that CPI inflation has moved from durable goods into services, and that it continues to rage in nondurable goods.
Consumer electronics CPI: This is a category where products have gotten immeasurably better and more powerful over the years. Think of your smartphone: it would have run circles around a huge super computer that cost many millions of dollars in the 1980s. And given the vast increases in power, utility, features, etc., the amount of money you pay for what you get has fallen year after year.
And it did in May too. The CPI for “information technology commodities” fell by 7.1% year-over-year, and the CPI for “video and audio products” fell by 5.2%.
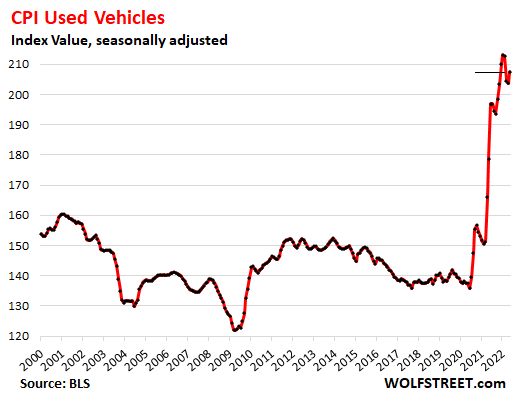
The used vehicle CPI, after having declined on a month-to-month basis for three months in a row, rose again in May, as I suspected it would, based on price increases in the used vehicle market. Month-to-month, the index rose 1.8%, and though a huge increase, it was lower than the crazy increases last year. Year-over-year, the CPI spiked by “only” 16.1%, which is still crazy, but less than half the year-over-year spikes in November through March.
This chart shows the index value (not the year-over-year % change of the index value). Clearly, the used vehicle CPI peaked at totally crazy levels, and some, but only “some,” of this crazy spike will unwind in 2022:
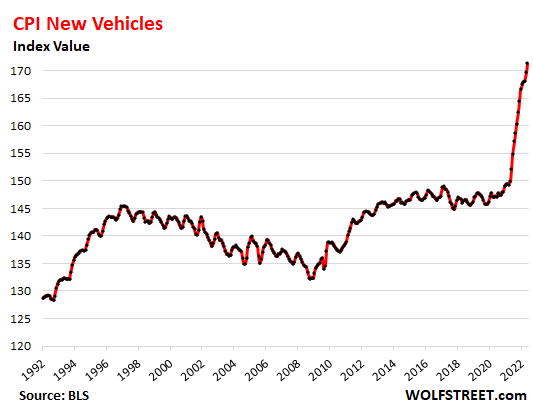
The new vehicle CPI spiked 1.0% for the month and by 12.6% year-over-year, the second-worst spike ever, after April, in the monthly data going back to the 1950s, amid widespread new vehicle shortages and ruthless “above-sticker” prices. But some models are now starting to see rising inventories amid the ongoing plunge in sales, which might eventually tamp down on this above-sticker pricing BS. Much higher interest rates would help bring demand down further, relieving some of the price pressures.
This chart shows the index value (not the year-over-year % change of the index value):
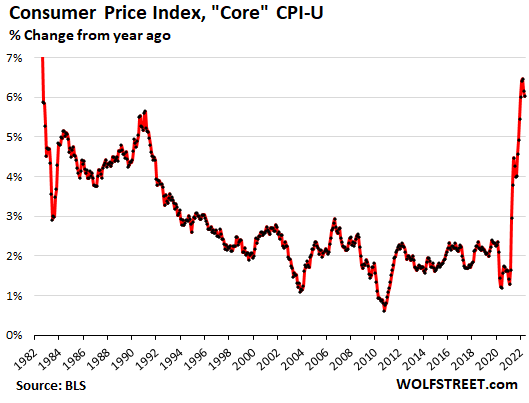
“Core” CPI.
The “core” CPI, which excludes the volatile commodities-dependent food and energy components, tracks inflation in the broader economy. Month-to-month, it jumped by 0.6% in May, same as in April, and accelerating from February and March. Year-over-year, it rose 6.0%, the third-worst since 1982, behind March and April:
And here is Fed Chair Jerome Powell’s reaction to today’s WHOOSH inflation blowout, as captured by cartoonist Marco Ricolli for WOLF STREET:
Ben Stein’s FREE Guide to Surviving Biden’s Double-Digit Inflation
Do you remember watching the value of your retirement account drop by 50% in the 2008 Financial Crisis? Ben’s new report could prevent you from going through that again. If you hold a retirement savings account worth over $50,000, you need this report!
Click Here Now For Your FREE Report!
