
Guest post by Wolf Richter from WolfStreet.com:
In the two years from the beginning of the Bank of Canada’s money-printing binge in March 2020 to the beginning of the rate-hike cycle in March 2022, the composite benchmark price had spiked by 54%. This spectacular housing bubble, on top of an existing housing bubble, was entirely fabricated by central bank money-printing and interest rate repression. This was a global phenomenon, triggering massive global inflation. So now comes the invoice for the drunken money-printing party.
The composite benchmark price of the Canada MLS Home Price Index for all types of homes has now dropped by C$151,300 in the nine months, to C$717,000.
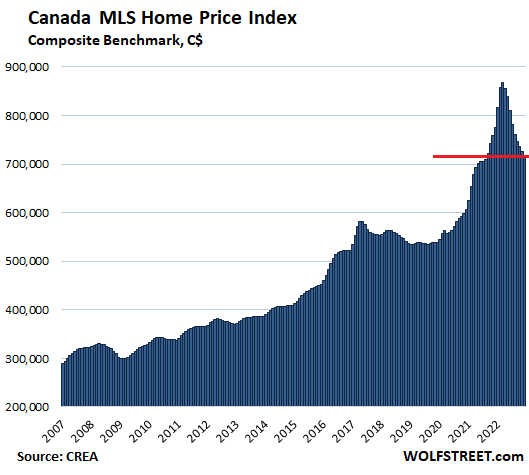
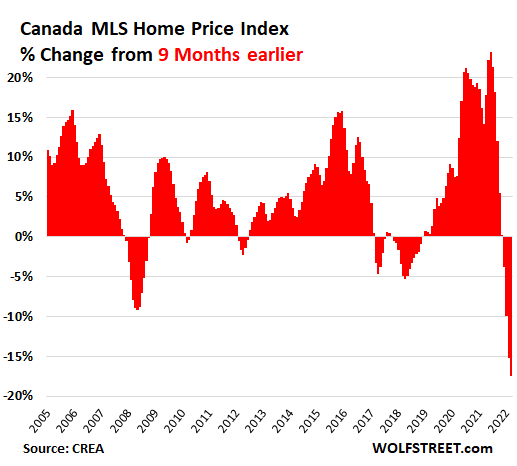
That 17.4% drop in the benchmark price from the peak in March was by far the largest and fastest nine-month drop in CREA’s data going back to 2005. In Canada, there wasn’t much of a housing bust during the Financial Crisis, but now the housing bust is here, and it’s real, and it’s not seasonal or whatever. Homes are being repriced on a large scale:
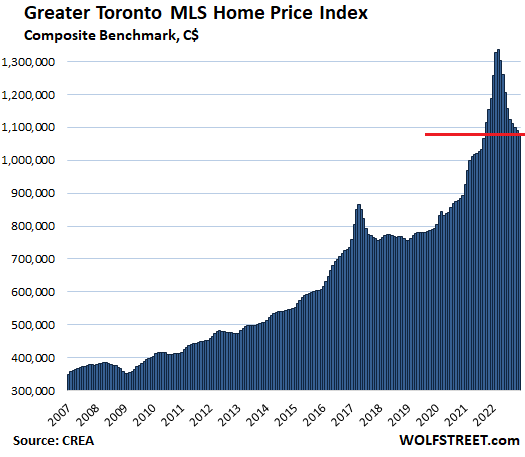
Greater Toronto Area: The MLS Home Price Index composite benchmark price dropped 0.8% for the month to C$1.08 million:
- From peak in March 2022: -19.0%
- Year-over-year: -8.9%
- Drop in 9 months from peak in March 2022: -C$253,600
- Jump in 9 months to peak in March 2022: C$313,000
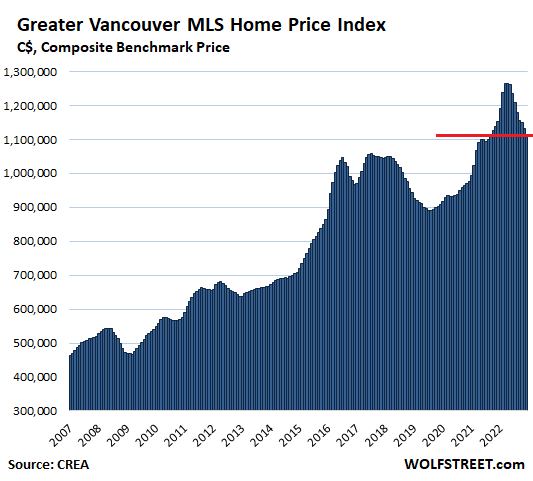
Greater Vancouver: The MLS Home Price Index composite benchmark price dropped 1.5% for the month to C$1.11 million:
- From peak in April 2022: -11.9%
- Year-over-year: -3.3%
- Drop in 8 months from peak in April 2022: -C$150,400
- Jump in 8 months to peak in April 2022: +C$163,300
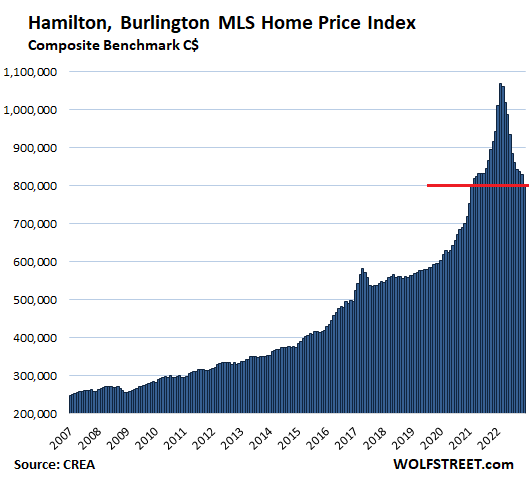
Hamilton-Burlington metro: Prices made even more spectacular moves than those in Toronto during the pandemic: From the beginning of the Bank of Canada’s money-printing binge in March 2020 to the price peak in February 2022, the composite benchmark price spiked by 70%. Now they’re heading back down even faster and more spectacularly.
The MLS Home Price Index composite benchmark price plunged another 3.3% for the month to C$803,200, the lowest since February 2021:
- From peak in February 2022: -24.9%
- Year-over-year: -14.8%
- Drop in 10 months from peak in February 2022: -C$265,600 – going down faster than up.
- Jump in 10 months to peak in February 2022: +C$244,400
Charts like this are just kind of funny:
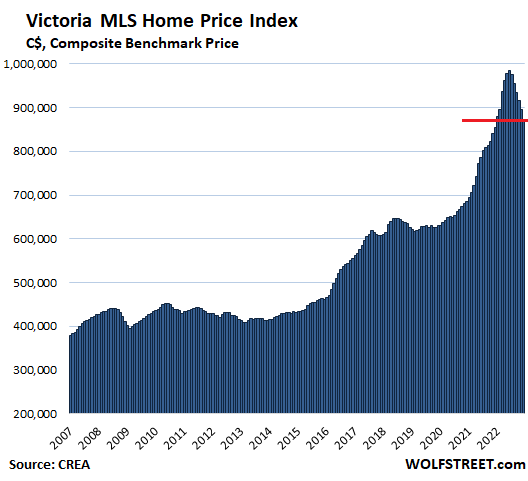
Victoria: The composite benchmark price dropped another 2.4% for the month to C$872,700:
- From peak in June 2022: -11.4%
- Year-over-year: +2.3%
- Drop in 6 months from peak in June 2022: -C$112,800
- Jump in 6 months to peak in June 2022: +C$132,200
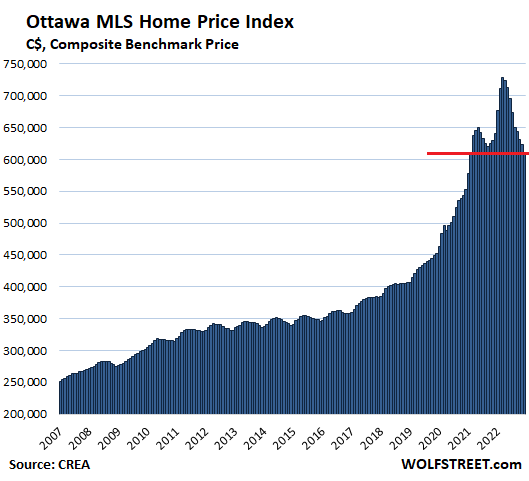
Ottawa: The composite benchmark price dropped 2.0% for the month to C$610,800:
- From peak in March 2022: -16.1%
- Year-over-year: -4.6%
- Drop in 9 months from peak in March 2022: -C$117,400 – going down far faster than up
- Jump in 9 months to peak in March 2022: +C$85,500.
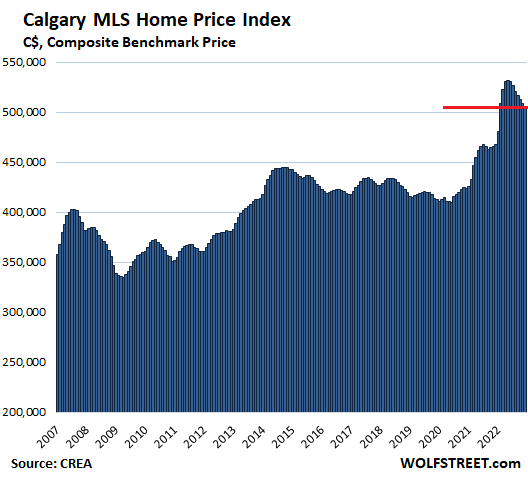
Calgary: Despite the oil boom, home prices are now falling in Canada’s oil capital. The composite benchmark price dropped 0.6% for the month, the seventh month in a row of declines, to C$506,400:
- From peak in May 2022: -4.8%
- Year-over-year: +8.1%
- Drop in 7 months from peak in May 2022: -C$25,800
- Jump in 7 months to peak in May 2022: +C$67,200:
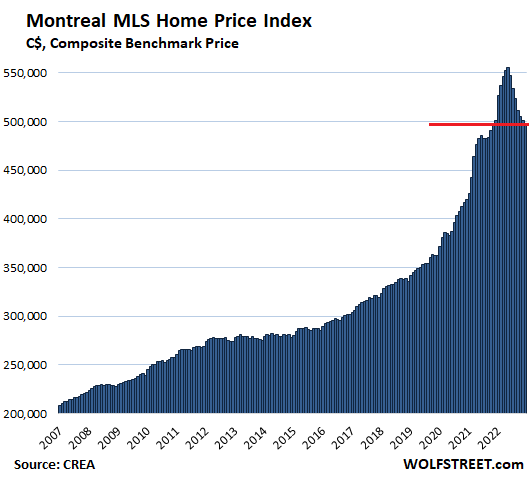
Montreal: The composite benchmark price dropped 0.6% for the month to C$497,800:
- From peak in May 2022: -10.4%
- Year-over-year: -0.7%
- Drop in 7 months from peak in May 2022: -C$57,800
- Jump in 7 months to peak in May 2022: +C$64,600:
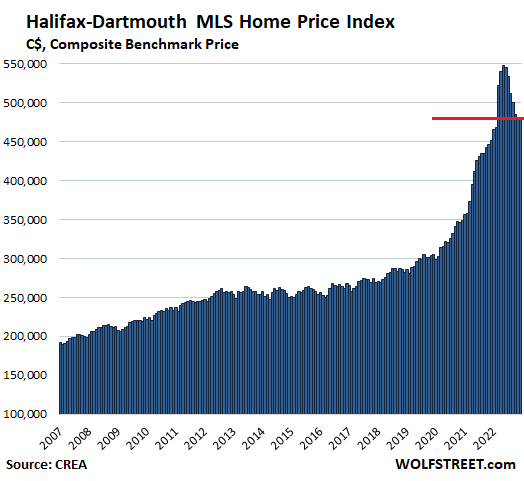
Halifax-Dartmouth: After years of housing sanity, the money-printing bug turned buyers’ brains to much. From February 2020 to the peak in May 2022, the benchmark price spiked by 81%.
The composite benchmark price, after huge plunges in the prior months, ticked up a hair in December (+0.2%), to C$480,600:
- From peak in May: -12.3%
- Year-over-year: +6.3%
- Drop in 7 months since peak in May: -C$67,200
- Jump in 7 months to peak in May: +C$105,200:
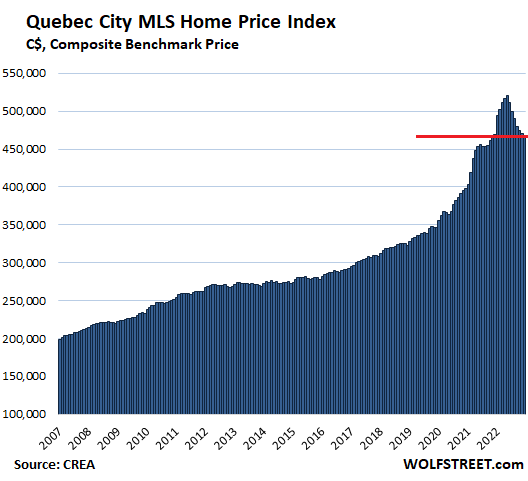
Quebec City: The composite benchmark price dropped 0.6% for the month to C$468,100:
- From peak in May: -10.0%
- Year-over-year: -0.3%
- Drop in 7 months since peak in May: -C$52,200
- Jump in 7 months to peak in May: +C$59,400:
Guest post by Wolf Richter from WolfStreet.com.
The Top 5 NASDAQ Stocks to Own for New Year 2023
Even in the worst of times, markets have rallied back. Just as they always have. So, if you’re thinking of quitting the market, don’t. There are plenty of bargains and hot investing ideas to jump on. In fact, here are five of our best ideas for 2023.
