

Editor’s Note: You could read the whole “shebang” below or simply look at the 3rd chart. Residential and Commercial housing continue to scream MAYDAY, MAYDAY, while elites and Big Bankers with little sense of what it actually costs to put food on the table and put gas in the car, call increased consumer spending a “positive role” in the economy.
I’ll give you two guesses what’s causing increased consumer spending and you won’t need the second: inflation.
Prices will continue to rise for “average joe” like you and I, while millennials like myself file the dream of home ownership under ‘wtf is wrong with the world’…
Guest post by Robert Hughes from the American Institute of Economic Research:
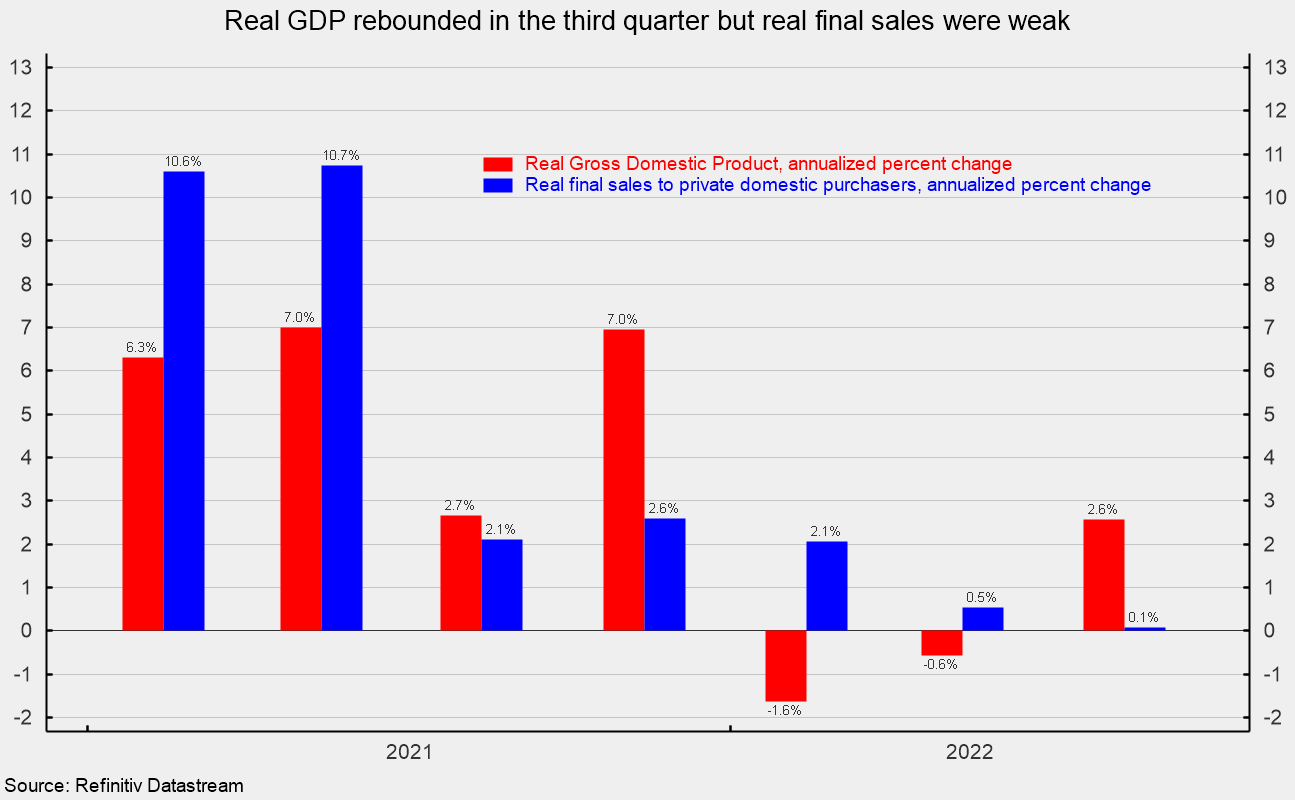
Real gross domestic product rose at a 2.6 percent annualized rate in the third quarter versus a 0.6 percent rate of decline in the second quarter and -1.6 pace in the first quarter (see first chart). Over the past four quarters, real gross domestic product is up 1.8 percent.
Real final sales to private domestic purchasers, about 88 percent of real GDP and a key measure of private domestic demand, has shown greater resilience, with growth having stayed positive despite declines in real GDP. However, growth has slowed significantly, from a 2.6 percent pace in the fourth quarter of 2021 to 2.1 percent in the first quarter, 0.5 percent in the second quarter, and just 0.1 percent in the third quarter (see first chart). Over the last four quarters, real final sales to private domestic purchasers are up 1.3 percent.
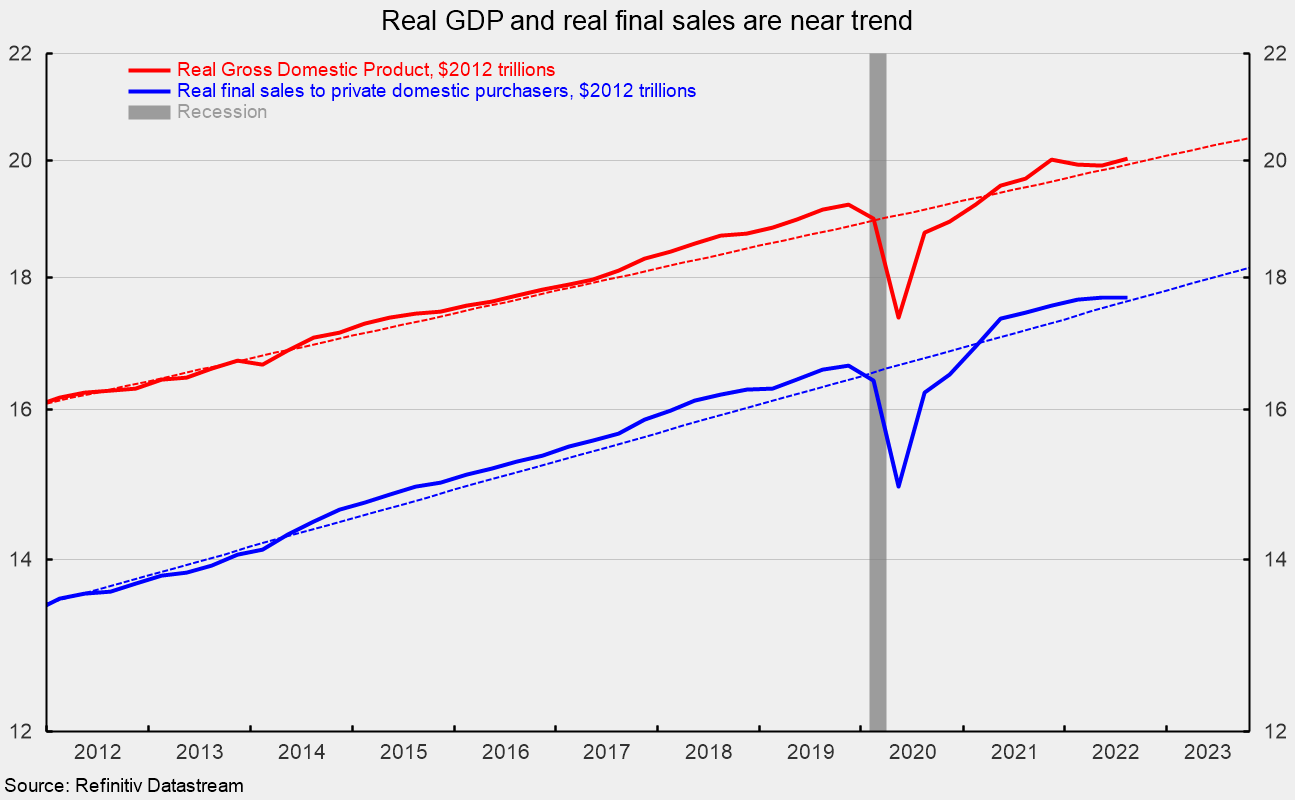
Real GDP and real final sales to private domestic purchasers are close to their 10-years trends (see second chart). The data shown in the current report are based on incomplete information and will likely be revised in subsequent releases.
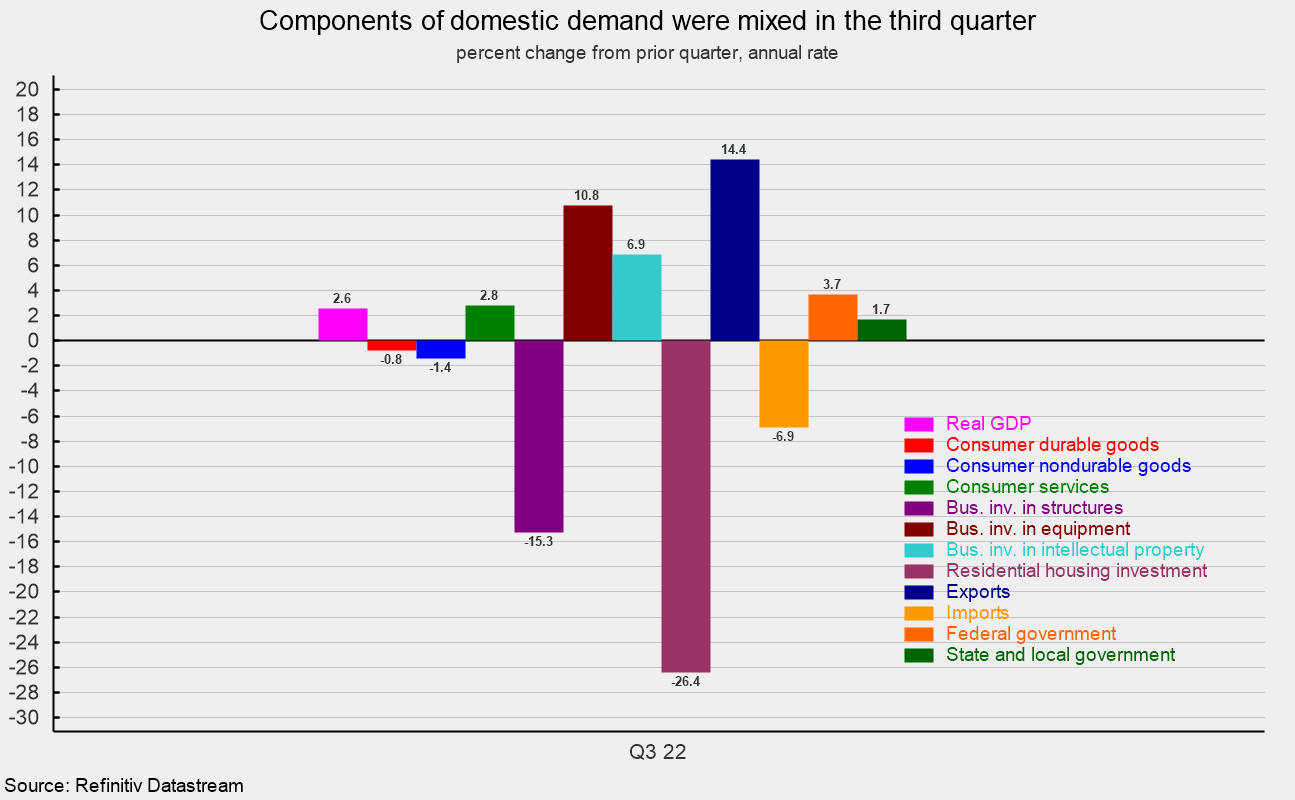
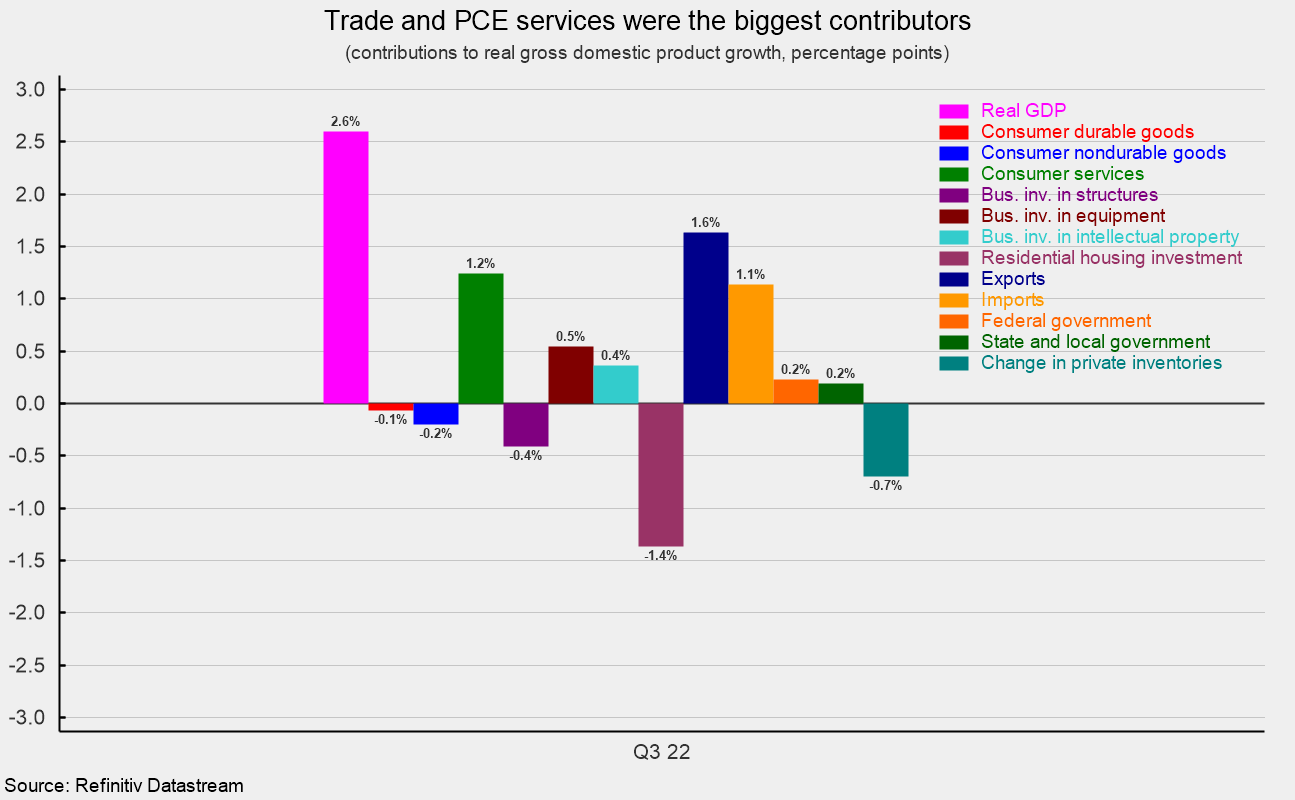
Headline numbers like GDP don’t provide a complete picture. Despite a solid result for real GDP growth, performance among the various components of GDP were mixed in the third quarter. Among the components, real consumer spending overall rose at a 1.4 percent annualized rate and contributed a total of 0.97 percentage points to real GDP growth. Over the last 40 years, consumer spending has posted average annualized growth of about 3.0 percent and contributed an average of 2.0 percentage points to real GDP growth. Consumer services led the growth in overall consumer spending, posting a 2.8 percent annualized rate, adding 1.24 percentage points to total growth. Durable-goods spending fell at a 0.8 percent pace, the second consecutive decline, subtracting 0.07 percentage points while nondurable-goods spending fell at a -1.4 percent pace, the third consecutive drop, subtracting 0.20 percentage points (see third and fourth charts).
Business fixed investment increased at a 3.7 percent annualized rate in the third quarter of 2022, adding 0.49 percentage points to final growth. Intellectual-property investment rose at a 6.9 percent pace, adding 0.36 points to growth while business equipment investment rose at a 10.8 percent pace, adding 0.54 percentage points. However, spending on business structures fell at a 15.3 percent rate, the sixth decline in a row, subtracting 0.41 percentage points from final growth (see third and fourth charts).
Residential investment, or housing, plunged at a 26.4 percent annual rate in the third quarter, following a 17.8 annualized fall in the prior quarter. The drop in the third quarter was the sixth consecutive decline and subtracted 1.37 percentage points from third quarter growth (see third and fourth charts).
Businesses added to inventory at a $61.9 billion annual rate (in real terms) in the third quarter versus accumulation at a $110.2 billion rate in the second quarter. The slower accumulation reduced third-quarter growth by 0.70 percentage points (see fourth chart). That followed a sizable 1.91 deduction from second quarter real GDP growth that more than accounted for the 0.6 percent decline in the headline result. Swings in inventory accumulation often add significant volatility to headline real GDP.
Exports rose at a 14.4 percent pace while imports fell at a 6.9 percent rate. Since imports count as a negative in the calculation of gross domestic product, a drop in imports is a positive for GDP growth, adding 1.14 percentage points in the third quarter. The rise in exports added 1.63 percentage points (see third and fourth charts). Net trade, as used in the calculation of gross domestic product, contributed 2.77 percentage points to overall growth, helping to hide the weakness in domestic demand.
Government spending rose at a 2.4 percent annualized rate in the third quarter compared to a 1.6 percent pace of decline in the second quarter, adding 0.42 percentage points to growth.
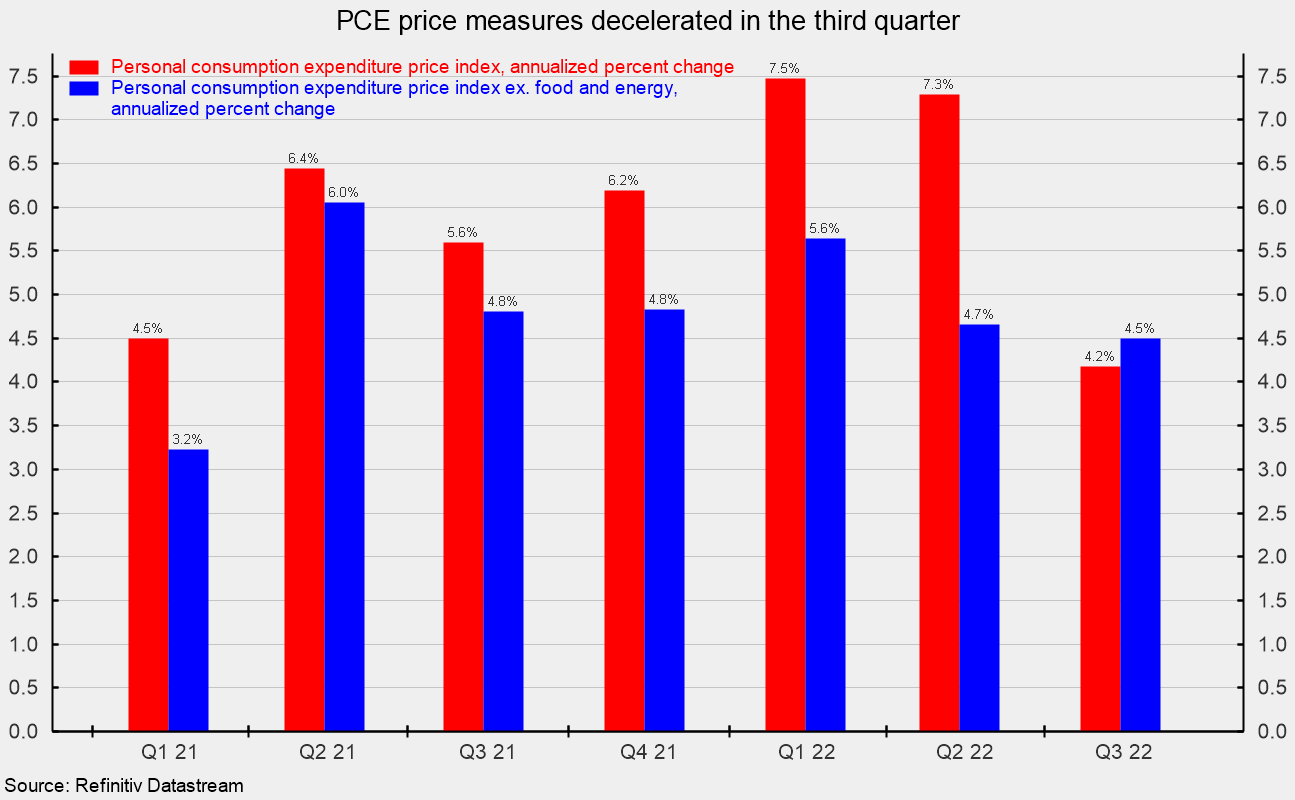
Consumer price measures showed another rise in the third quarter, though the pace decelerated. The personal-consumption price index rose at a 4.2 percent annualized rate, below the 7.3 percent pace in the second quarter and the 7.5 percent rate in the first quarter. From a year ago, the index is up 6.3 percent. However, excluding the volatile food and energy categories, the core PCE (personal consumption expenditures) index rose at a 4.5 percent pace versus a 4.7 percent increase in the second quarter and 5.6 percent in the first quarter. That is the slowest pace of rise since the first quarter of 2021 (see fifth chart). From a year ago, the core PCE index is up 4.9 percent.
Lingering upward price pressures have resulted in an aggressive Fed policy tightening cycle. Caution is warranted.
Guest post by Robert Hughes from the American Institute of Economic Research.
4 Top Stocks for a Bear Market
Historically, things like precious metals, consumer staples, commodities, utilities, health care, and transportation stocks have performed well in a bear market. Our experts say these 4 stocks are positioned well – even in a down market.
Click here to get the names & ticker symbols of all 4 stocks.
