
Guest post by David Brady from Sprott Money:
Nothing goes up in a straight line. In Elliott Wave terms, the peak in Wave 1 is “always” followed by Wave 2. Even the gargantuan rally from the low in August 2018 to the new record high in August 2020 had a wave 2 follow wave 1, despite the strength of the initial rally. I don’t see a clear wave 2 reversal anywhere since the rally began in November. This means that it has yet to come.
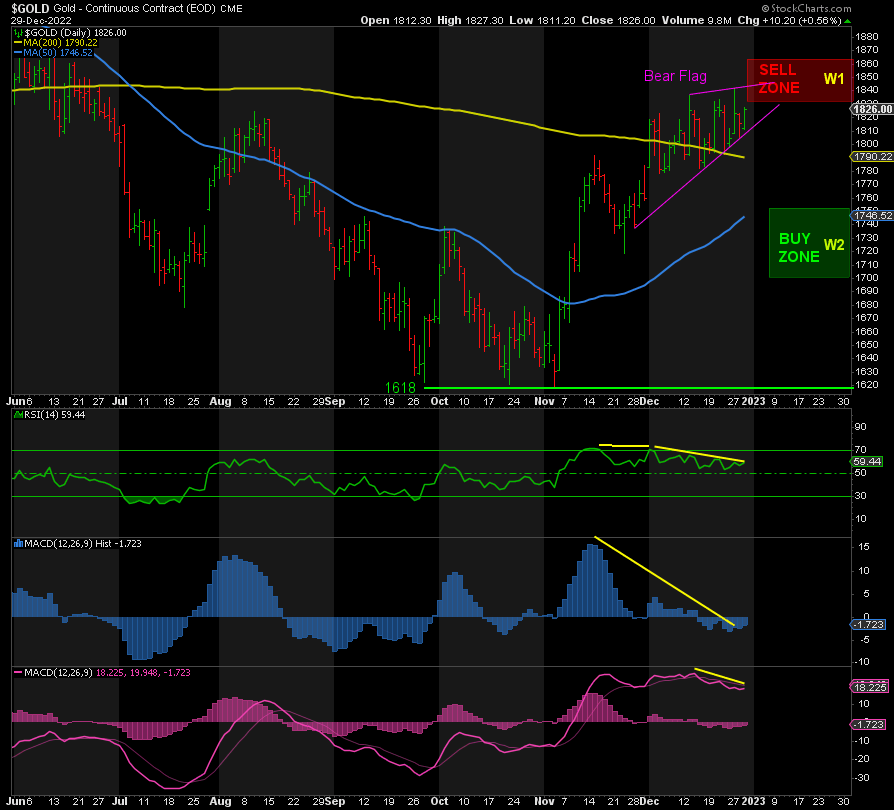
Gold is also exhibiting a ‘Bear Flag’ pattern. This increases the probability that the next big move is down. It could be a fake breakout to the upside, which would be extremely bearish, or a break down through support current at 1808. This does not rule out a move up to 1860 first. Either way, a higher high first or straight down, we get a pullback.
At the same time, momentum, which typically leads price, is heading south across all indicators, making the recent higher highs in Gold negatively divergent. You can see how price soared in November but has struggled to move higher ever since, confirming the slowdown in momentum.
My primary target range on the downside would be 1750-1700 for the bottom of Wave 2.
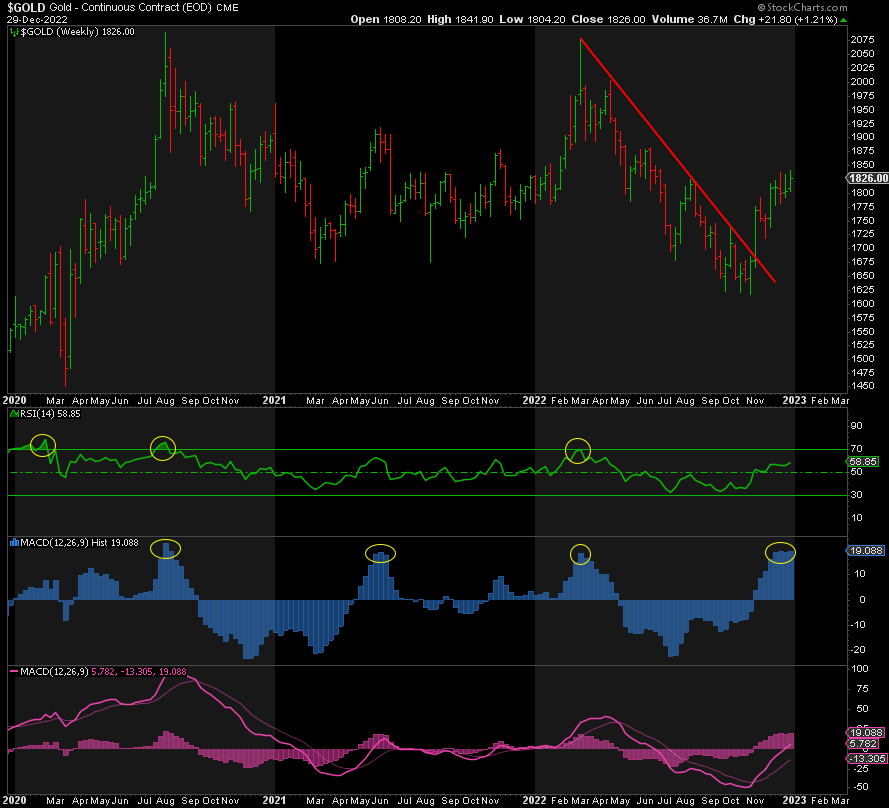
The weekly charts show the breakout to the upside in November. Although the RSI and the MACD Line both show there is plenty of room to the upside before becoming overbought, this just reinforces the coming rally to new highs imho. However, the MACD Histogram has been stuck at elevated levels for weeks, levels which have triggered drops of $250 to $500 three times in the past three years. While I am not expecting such a drop, it is sufficient for a pullback of 100-150.
DXY
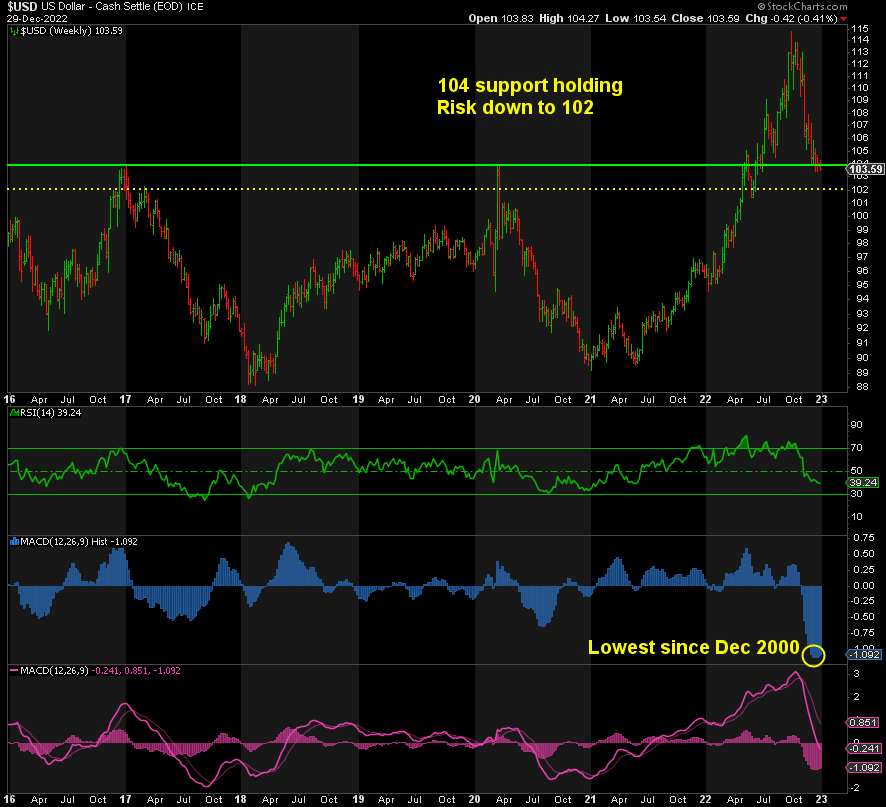
Starting with the weekly chart, we can see that the DXY has fallen over 12 big figures to 103.50 and has been flirting with support at 104 for the past few weeks. Below there is additional support at 102, the 50% retracement of the entire move up from 89 to 115. While I don’t believe 102 would be the bottom, DXY is overdue for a healthy rebound to 106-110 before it heads lower again. The MACD Histogram is a mirror image of that in Gold. It bottomed out at its lowest level since 2000 and is now turning up, which signals a big bounce is coming.
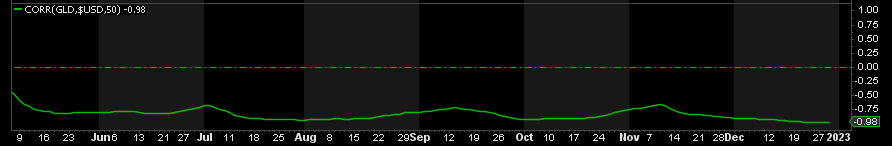
And as long as the near perfect inverse correlation between Gold and the DXY remains in place, a dollar reversal to the upside would clearly weigh on Gold and the rest of the sector.
In summary, the risk to the downside in the DXY is a mere dollar 50, whereas the upside is 2.50-6.50. The risk reward is clearly skewed to the upside, which doesn’t bode well for Gold.
REAL YIELDS
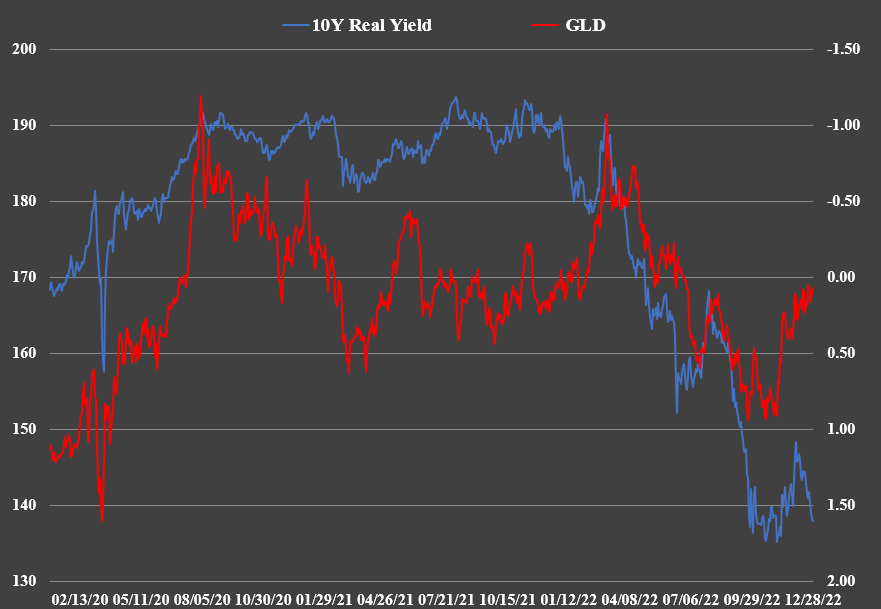
Then there is the 10-Year real yield, the most reliable inter-market factor affecting Gold. When real yields rise, Gold falls, and vice-versa. Well, real yields have been rising again recently while Gold continued to rally. Such breakdowns in their direct relationship typically resolve soon after, which means either Gold or real yields fall, or both. Yet another storm cloud hanging over Gold after a strong rally from 1618.
In conclusion, there are numerous data signals that Gold’s rally is running out of steam and it’s headed lower, including it being the most bullish since the peak in March at 2079. All it takes is a sustained break of 1808.
BULL CASE FOR GOLD
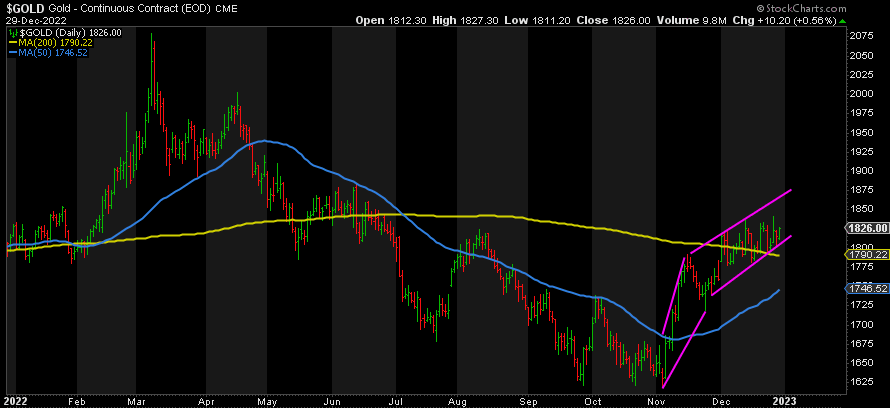
The trend in Gold is clearly up. We’ve got a series of higher lows and higher highs. This does not negate a pullback. In fact, Gold could fall to 1741, a single dollar above the low of 1740, and still be in an uptrend. But the trend is your friend until it isn’t and unless and until we break rising support at 1808, Gold can continue to go higher and higher regardless of extreme and overbought conditions.
With regard to the DXY, it could continue to fall. Ever since the Fed began tapering its rate hikes, the DXY has plummeted. With inflation data slowing and the economy sliding into recession as jobless claims rise, it sure looks like 25 basis points is the most we can expect from the Fed in terms of the next rate hike. This further undermines the case for a stronger dollar, which would boost Gold.
The same goes for real yields. While they have risen while Gold did too, if real yields turn down, that should be supportive of higher Gold prices.
Then there is the COT data showing that open interest is at its lowest level since 2018 when Gold reached 1167 and took off to 2089. The Commercials also have their lowest short position since early 2019.
CONCLUSION
In conclusion, a strong trend can negate other indicators, such as extreme sentiment, divergences, momentum, and factors like the DXY and real yields, for quite some time before it reverses. But reverse it always does. Wave 2 always follows Wave 1. The key question is from what price?
For those of you who are long, if you believe the bottom is in as I do, then you can choose to just ride out any pullbacks along the way, and buy the dips as they come. For those of you who don’t own any physical metals, I recommend you consider buying on the dips, because they will come. I don’t recommend shorting a bull market. You could get run over by sharp moves higher. Only a drop below 1675 would signal that lower lows are possible.
I believe there is a sizeable pullback pending, confirmed by a break of support, but I won’t be shorting Gold, Silver, or the miners. I’ll be waiting to buy the dip because what follows plans to be a spectacular rally. It’s called Wave 3!
Guest post by David Brady from Sprott Money.
Do you know which numbers really enhance your trades?
You might be surprised to learn that they aren’t on an earnings report or a quarterly statement… Instead, they’re living in the stock prices themselves! I’m Tom Busby, founder of the Diversified Trading Institute and with my “Little Black Book”, you can learn how to harness the power of these key numbers today and enjoy a stronger trading account tomorrow!
