
Treasury deficit is nearly three times larger than July 2018. How is the Fed helping? They’re not. Schiff explains how…
posted by Peter Schiff on SchiffGold.com:
The Federal Government ran a $211B deficit in July. Except for February, this was the largest deficit since last July when the Treasury ran a deficit of $302B, and it was the second-largest July deficit ever.
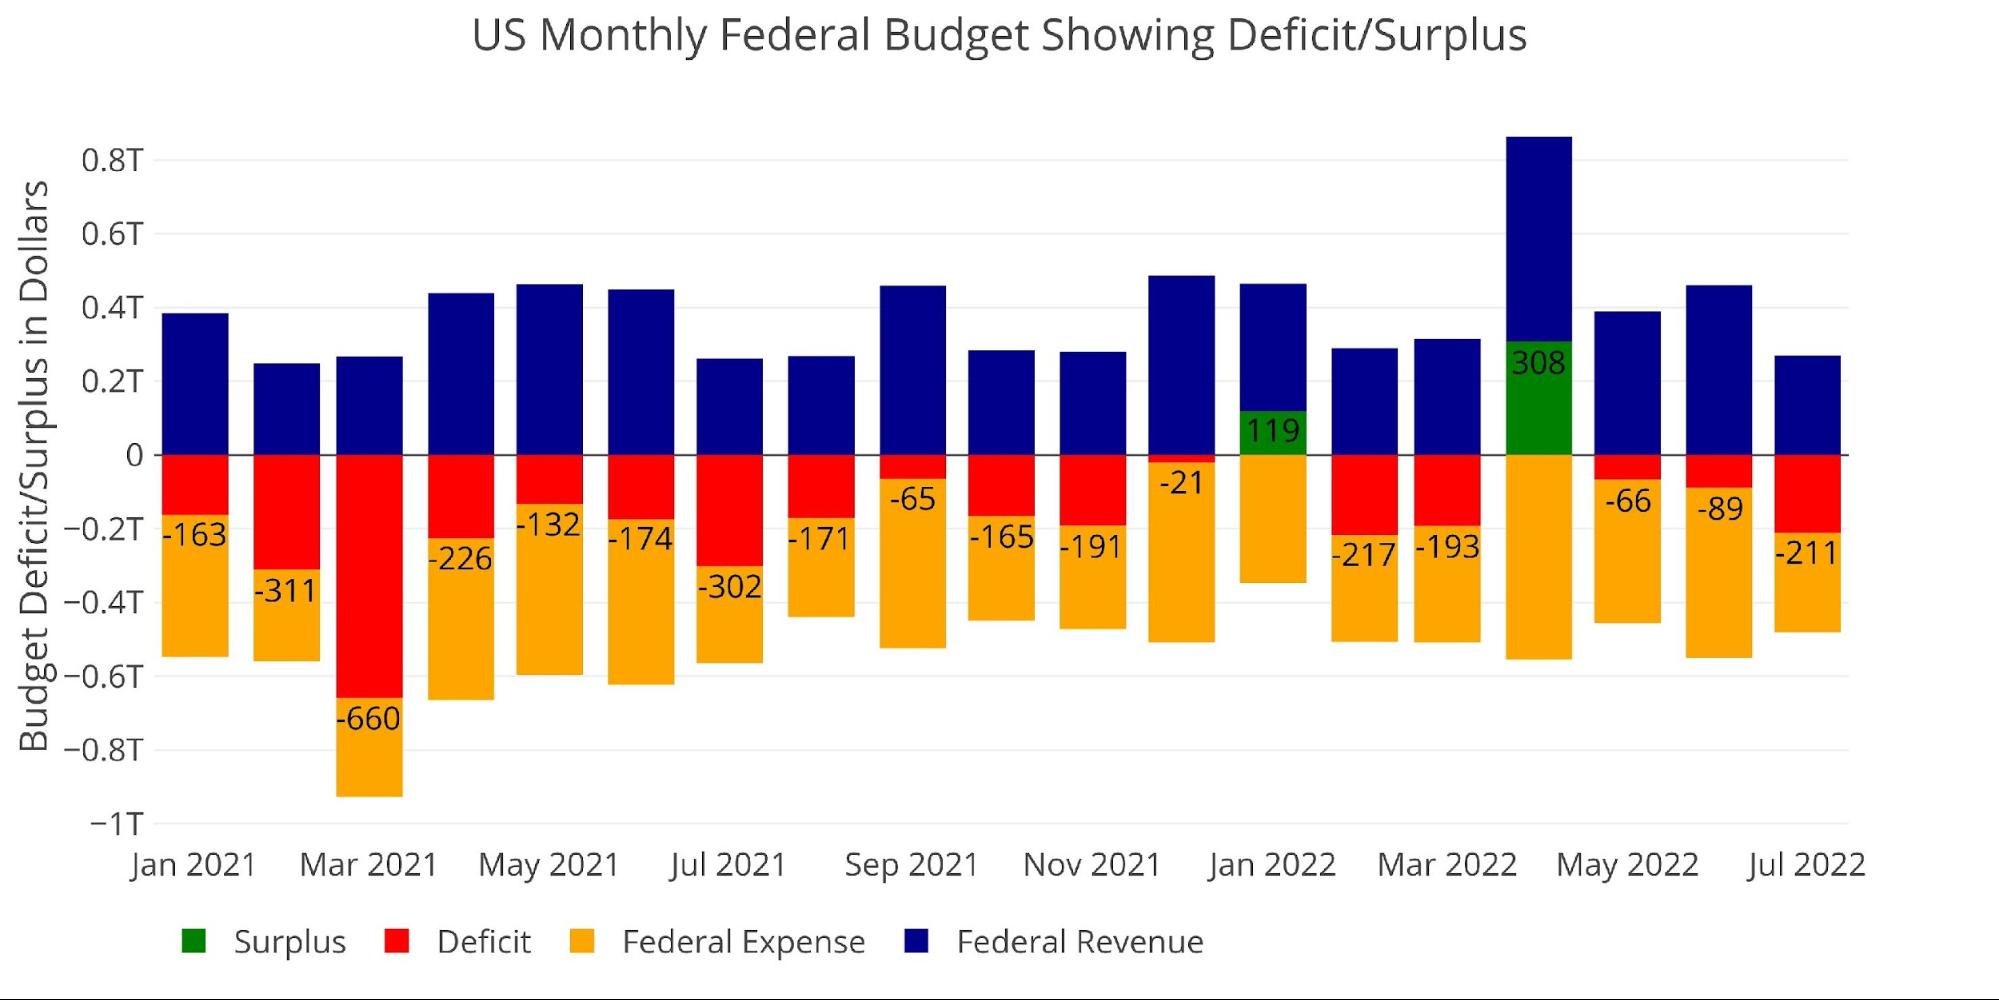
Figure: 1 Monthly Federal Budget
Looking historically, this is the second largest July deficit ever recorded behind last July. In July 2018 and 2019, the last normal years before Covid, the Treasury ran a deficit of $76B and $120B respectively. This July was nearly three times larger than July 2018.
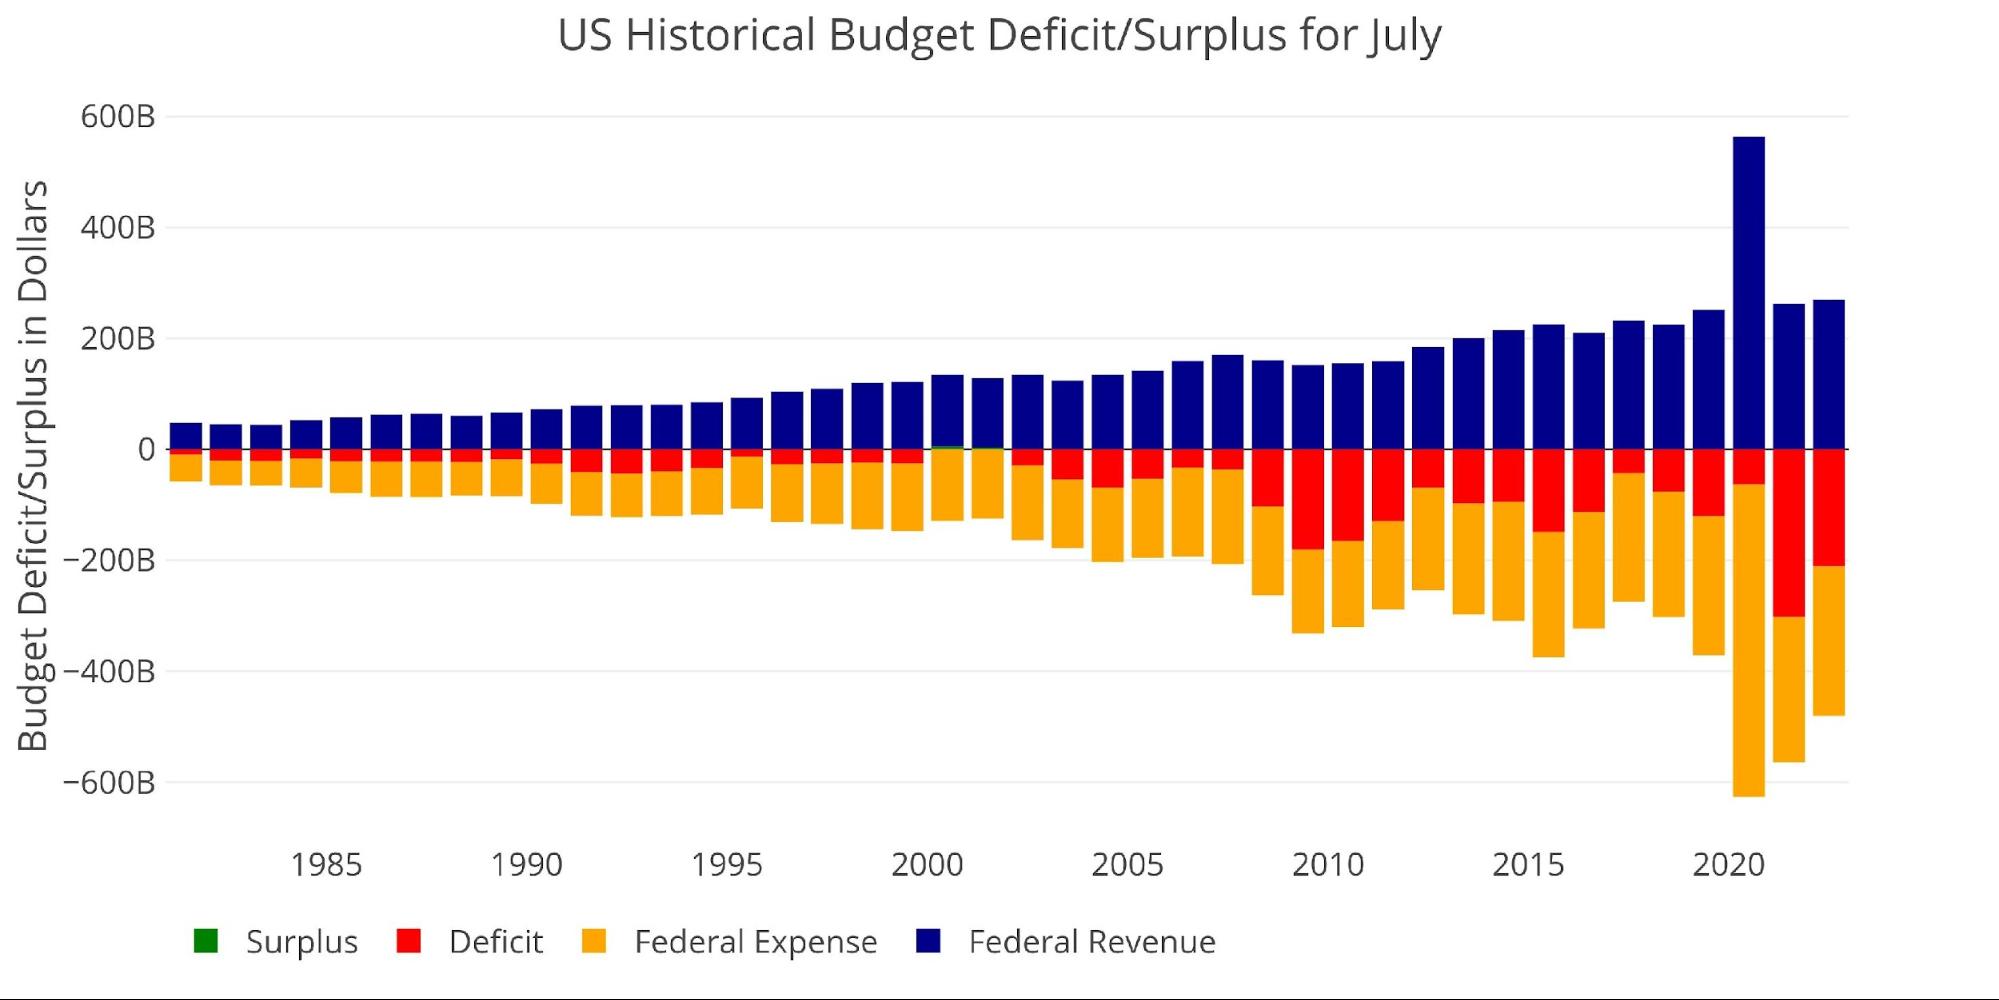
Figure: 2 Historical Deficit/Surplus for July
The historical average for July is $118B, which makes this July 79% above average.
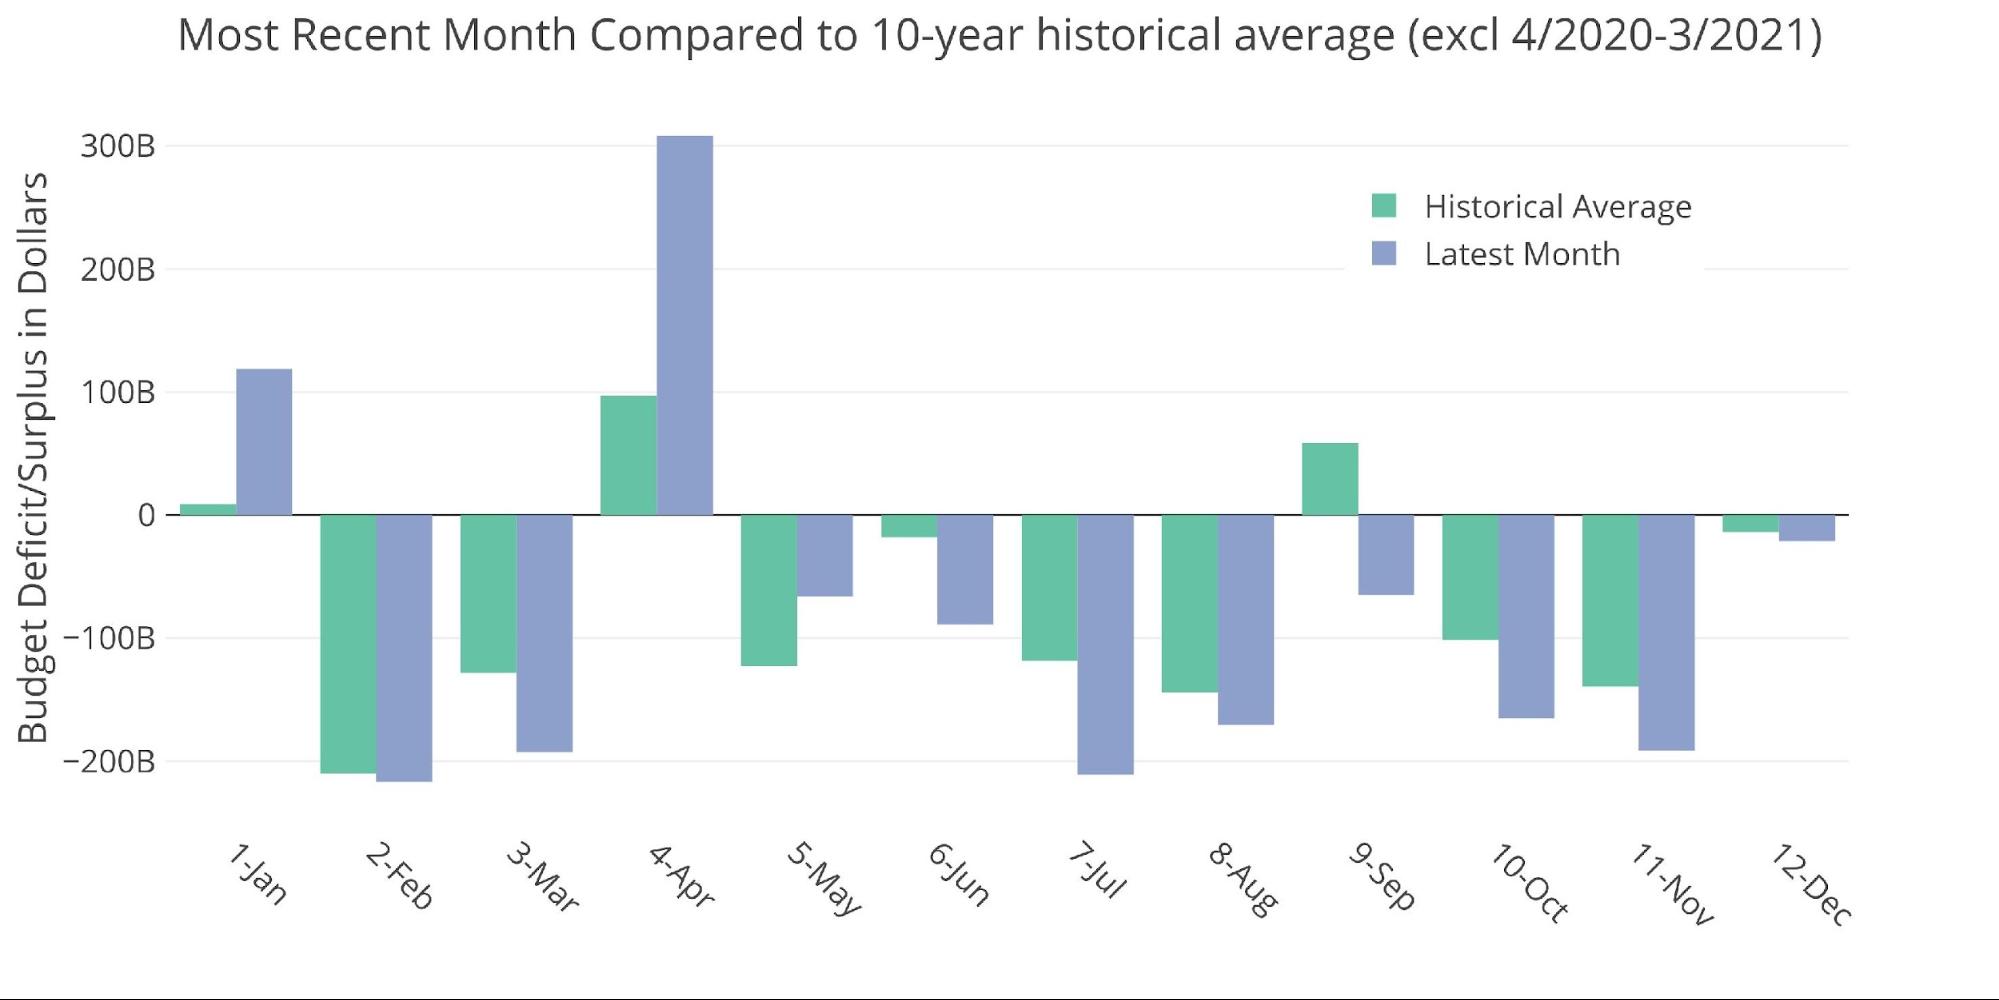
Figure: 3 Current vs Historical
The Sankey diagram below shows the distribution of spending and revenue. The Deficit represented 44% of spending in the most recent month.

Figure: 4 Monthly Federal Budget Sankey
The monthly figure was significantly larger than the TTM deficit which only represented 16.55% of total spending, or $958B.
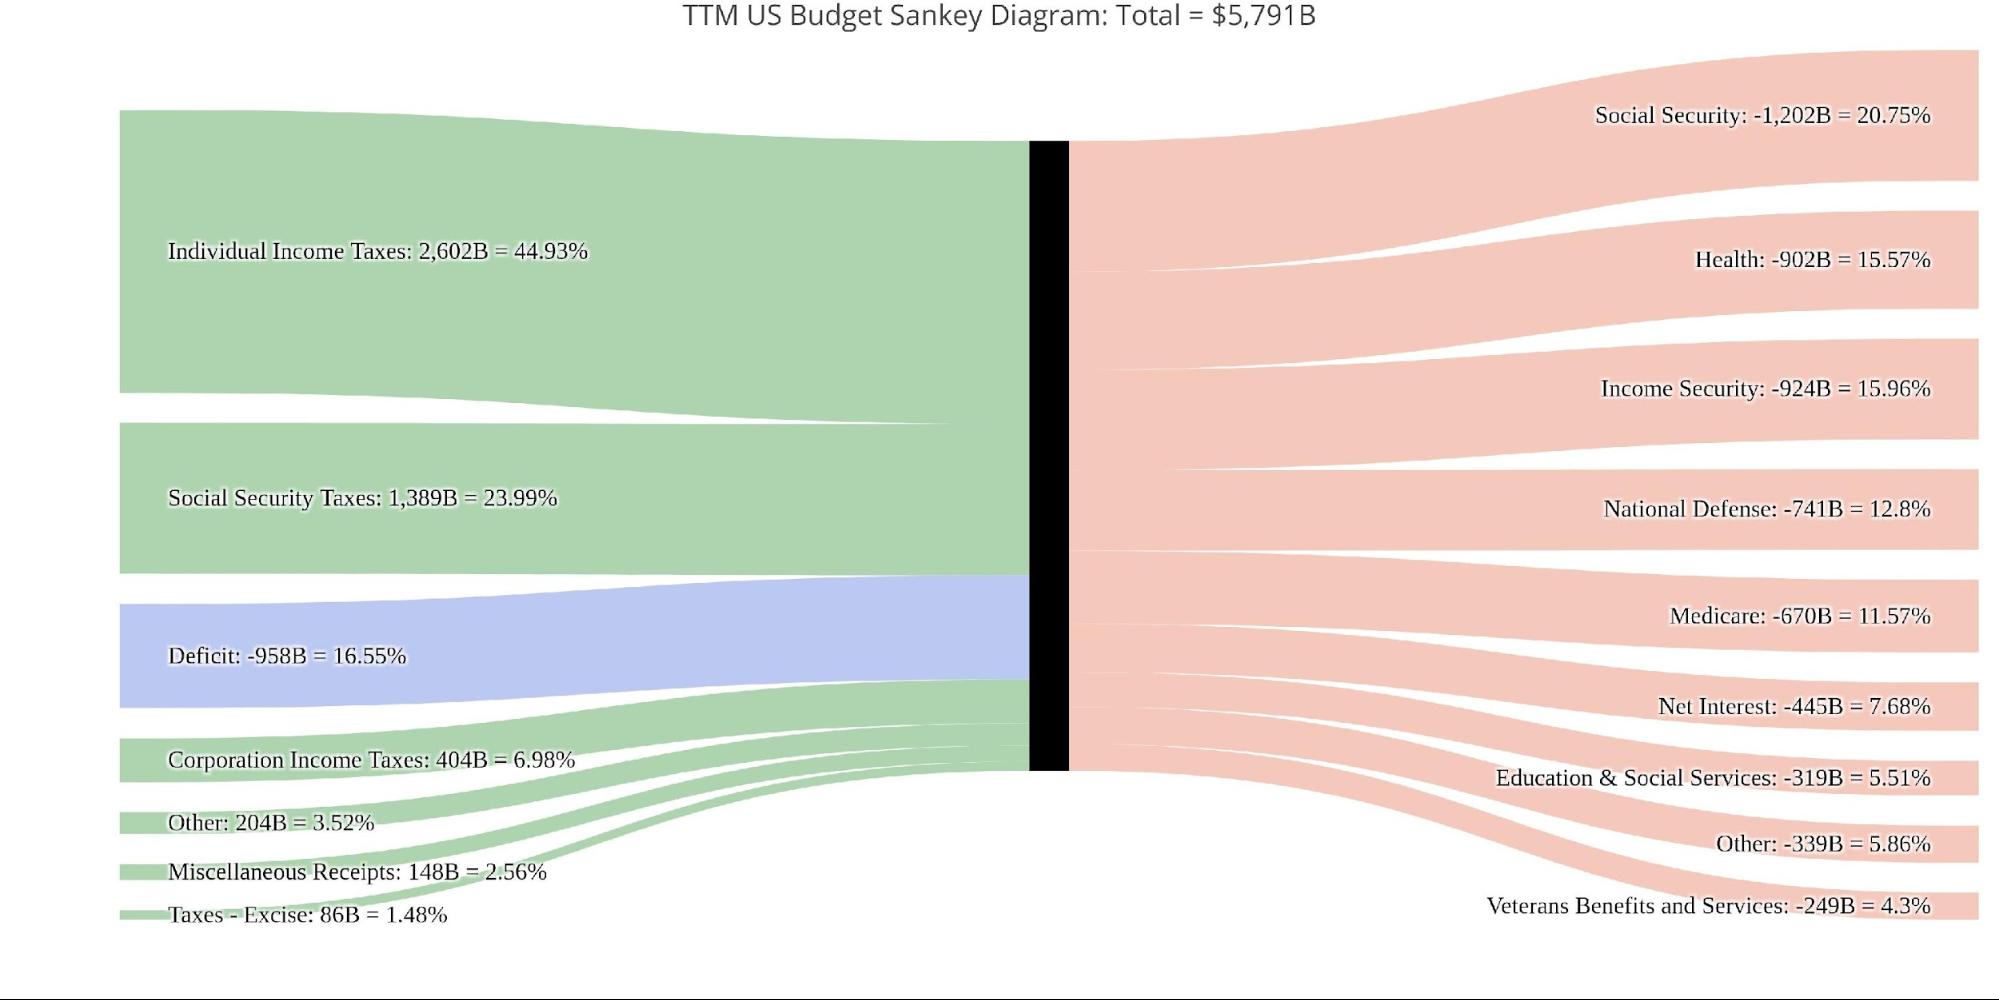
Figure: 5 TTM Federal Budget Sankey
Total revenue was the smallest since August of last year. This was due to a big fall in Individual Taxes and a drop in Corporate Taxes which is much more volatile from month to month.
The drop in Individual Taxes is something to note. In recent months, Individual taxes have been way above normal. The surge in revenues has helped offset much larger expenditures and help contain the deficit. The Treasury does not provide detail on revenue beyond the high-level categories, so it’s impossible to know the detailed source.
A recent report by the CBO highlighted the government provisions that drove the revenue surge along with deferred tax payments and the growing stock market. The surge was not expected to last and may have already come to an end.
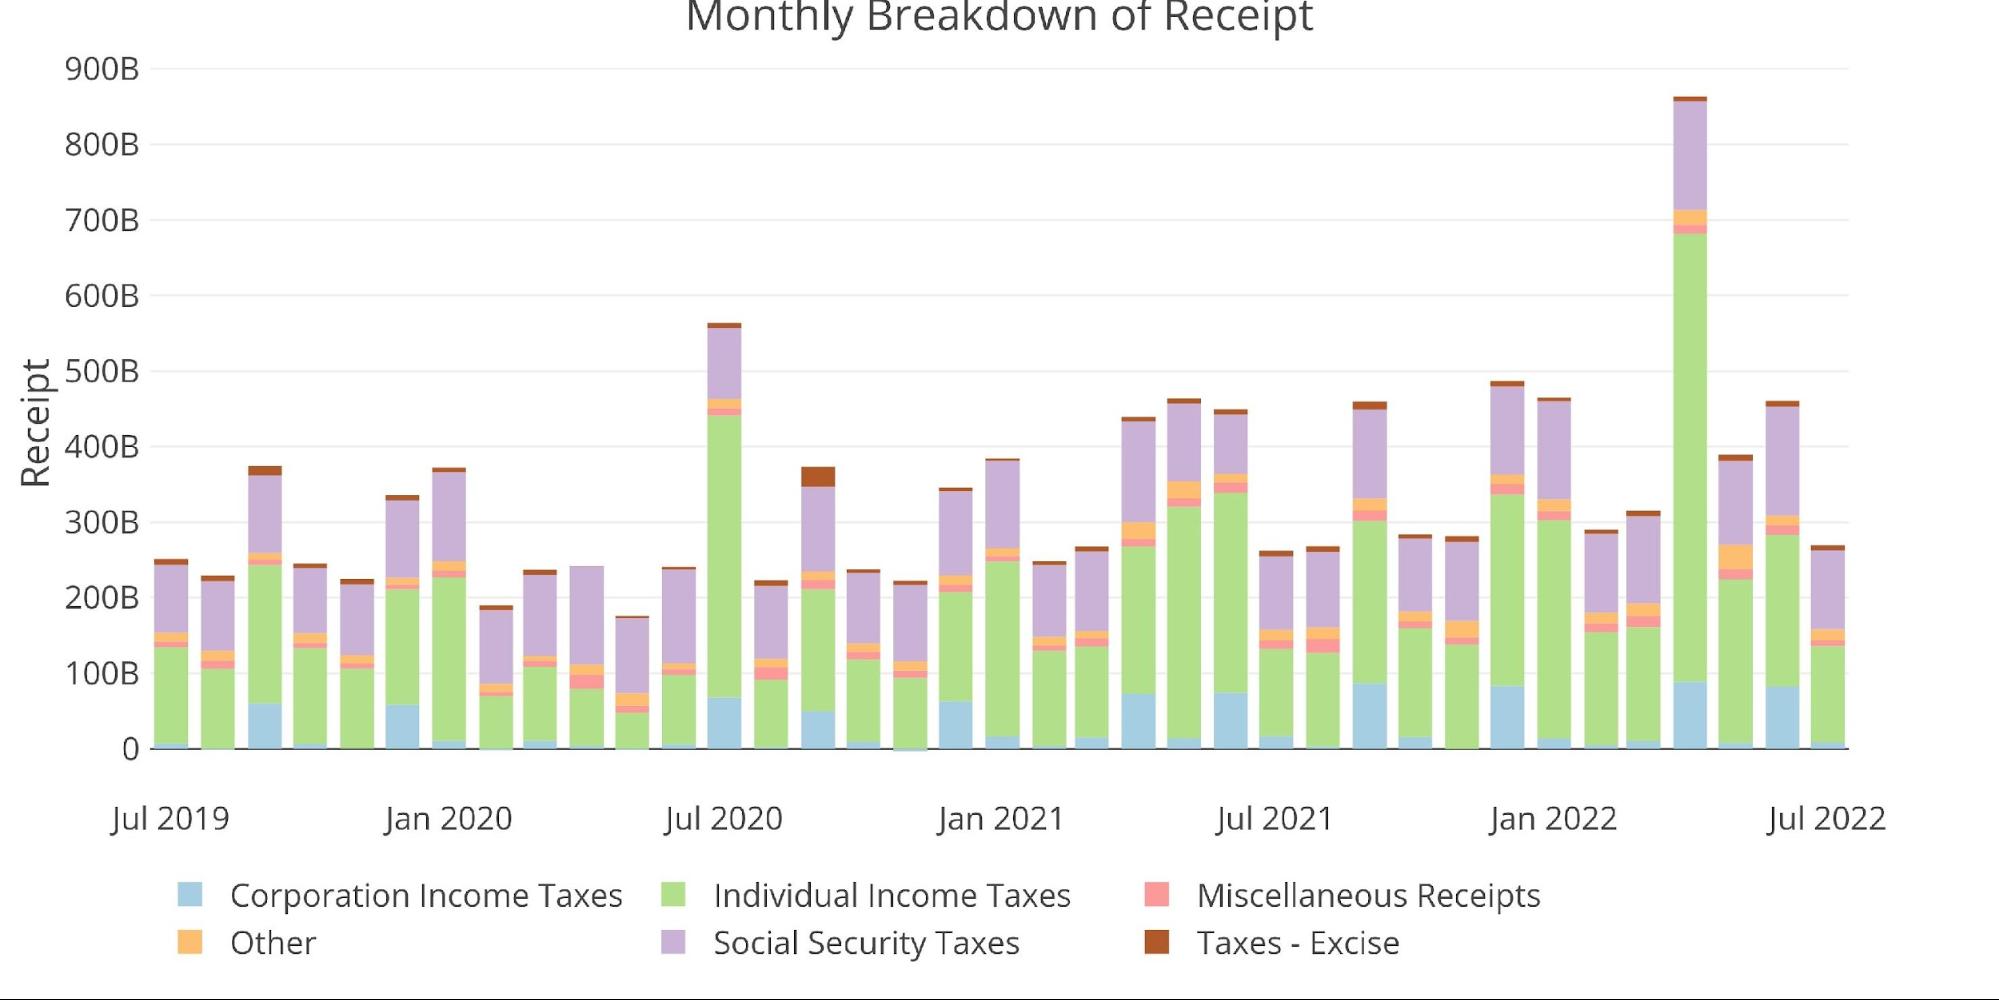
Figure: 6 Monthly Receipts
The Expense side was below four of the last five months. This was mainly due to a fall in Income Security.

Figure: 7 Monthly Outlays
Perhaps the most important expense to take note of is Interest Expense. As explained in the debt analysis, interest costs have been soaring lately. Last July, TTM interest expense was $351B. That figure now stands at $445B or 26.7% higher.
Even more discouraging is that this barely includes the combined 150bps rate hikes in June and July. As these rates start to roll into the debt, interest costs will only increase. This will become a major headwind for the Treasury as annual interest cost looks set to exceed $500B before in short order.
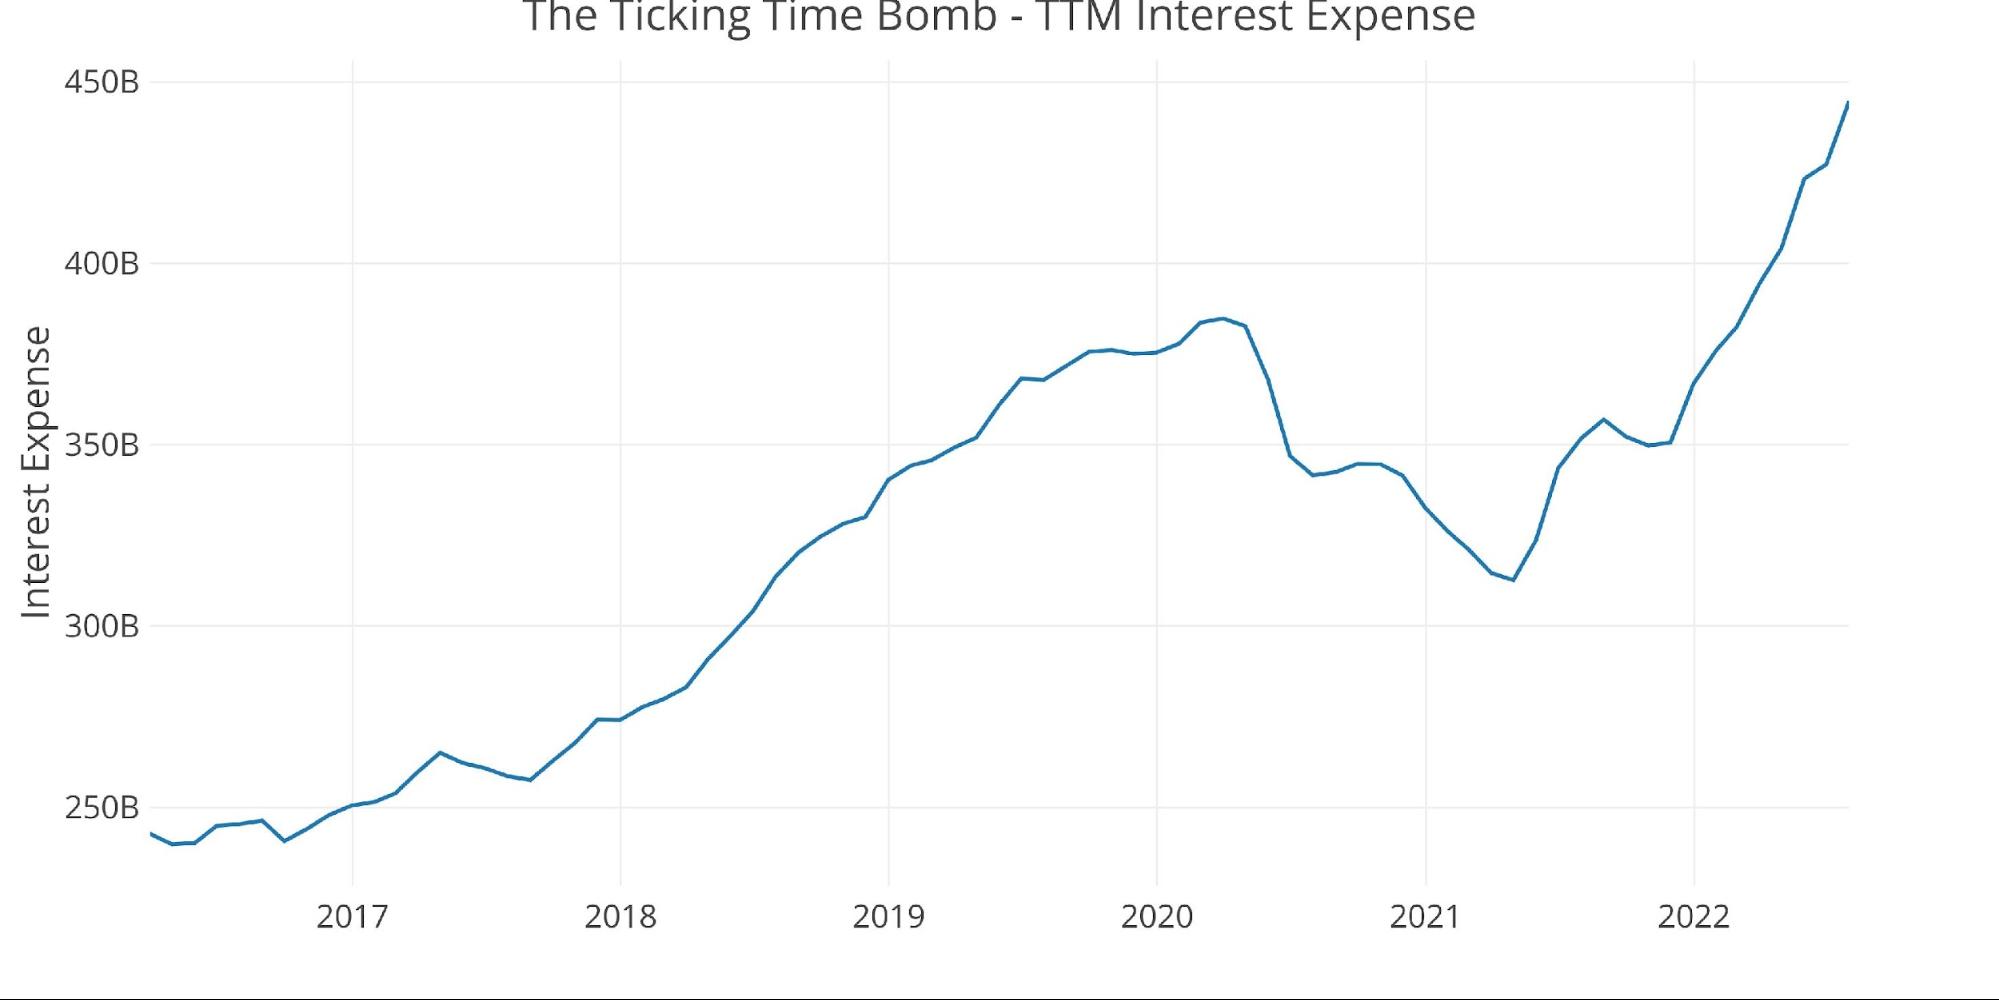
Figure: 8 TTM Interest Expense
The table below goes deeper into the numbers of each category. The key takeaways from the charts and table:
Outlays
-
- Monthly net interest is almost 50% above the 12-month average
- Medicare dropped 30% YoY but is still 20% above the TTM
- On a TTM basis, Social Security is up 6.5% YoY and up 10.5% since July 2020
Receipts
-
- Social Security Taxes are keeping up with expenses, rising 11.7% since July last year
- Individual Income Taxes are up YoY by 11.2% but below the 12-month average by 41%
Total
-
- The Total TTM Deficit fell below $1T to $958B. This is 66.5% below the $2.8T deficit from July 2021
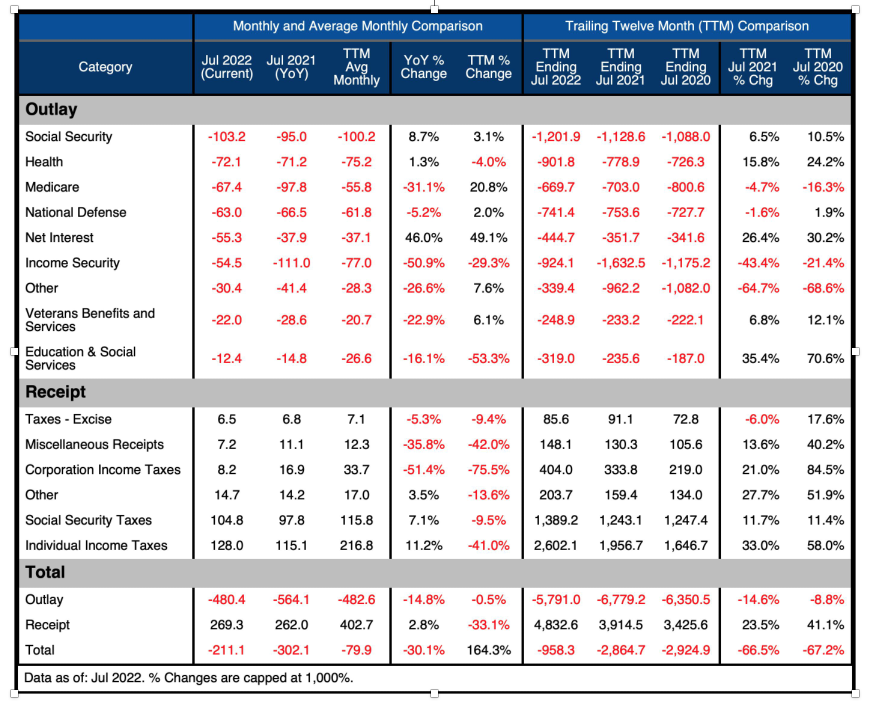
Figure: 9 US Budget Detail
Historical Perspective
Zooming out and looking over the history of the budget back to 1980 shows a complete picture. It shows how a new level of spending has been reached and is only being somewhat supported by a major surge in tax revenues.
While the deficit has fallen in response, it’s not falling far or fast enough to make a difference.
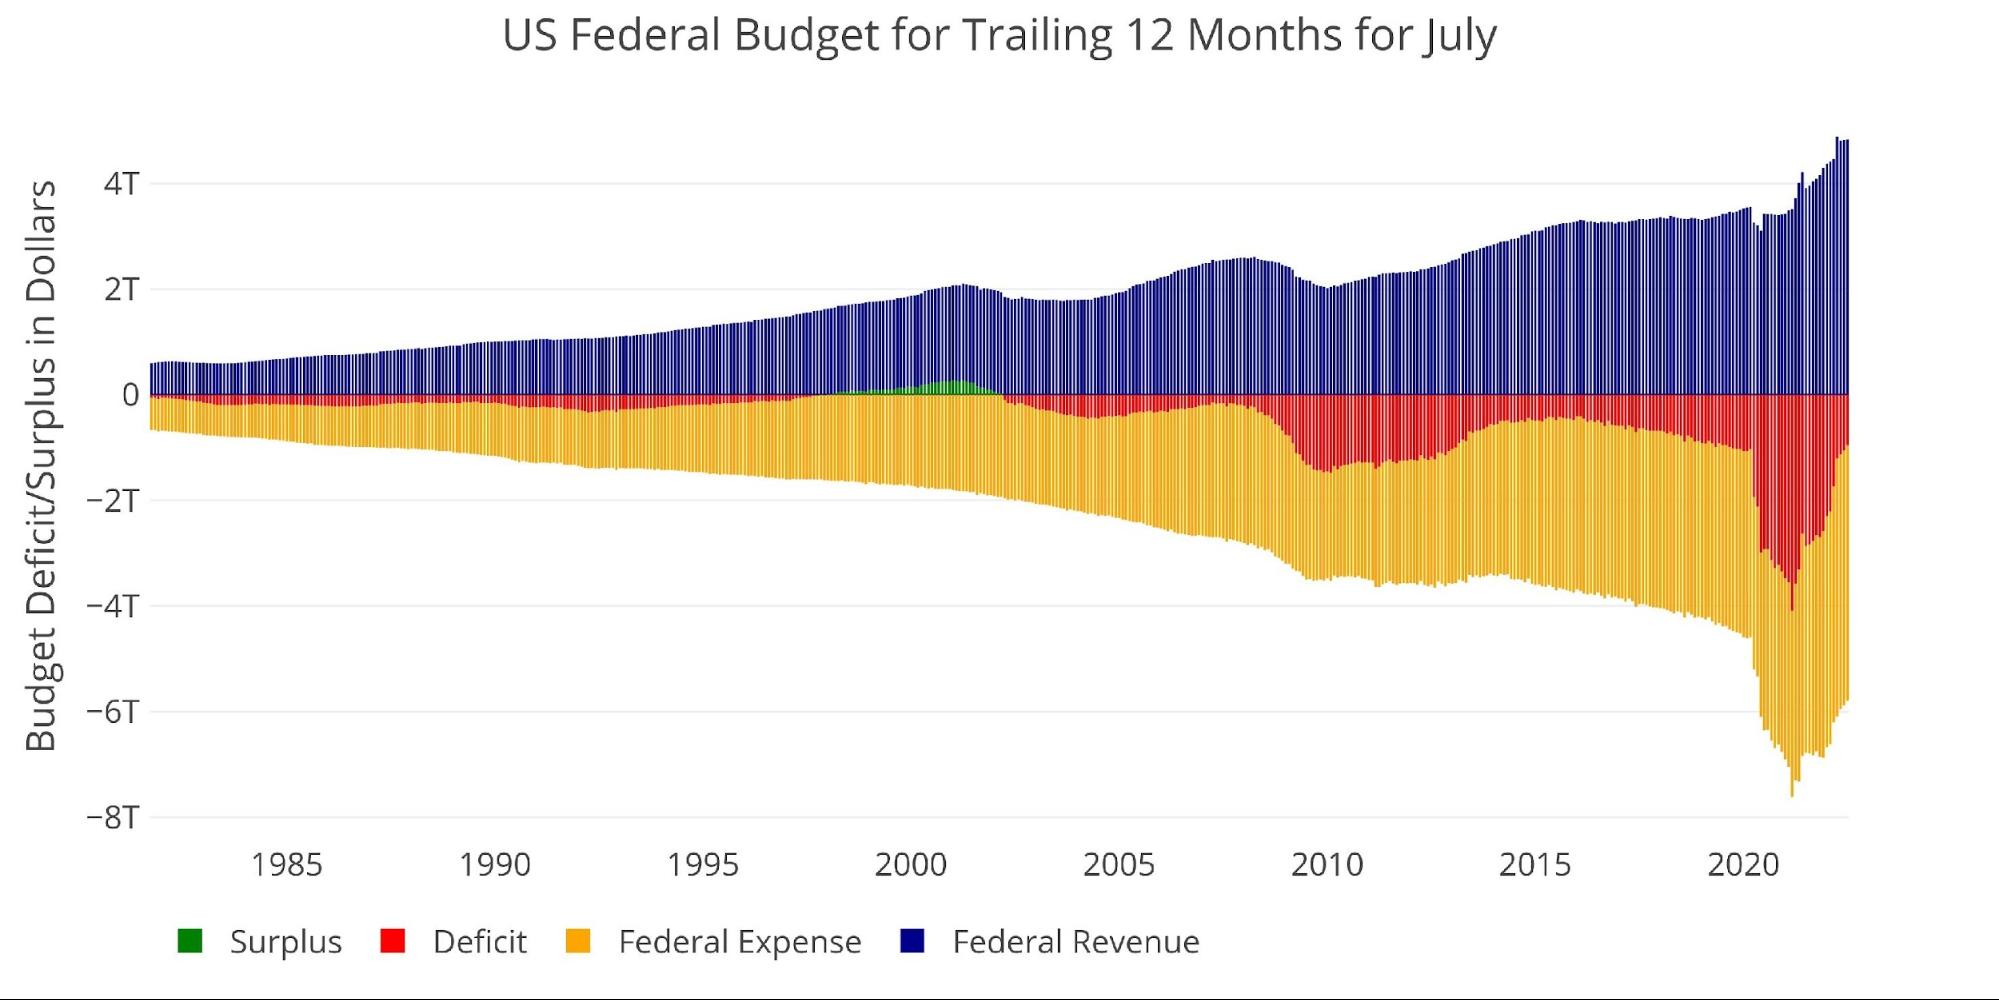
Figure: 10 Trailing 12 Months (TTM)
The next two charts zoom in on the recent periods to show the change when compared to pre-Covid. The current 12-month period is $1.4T bigger than pre-Covid levels of 2019. Individual Taxes make up the vast majority of the difference, with 2022 exceeding 2020 and 2019 by almost $1T.
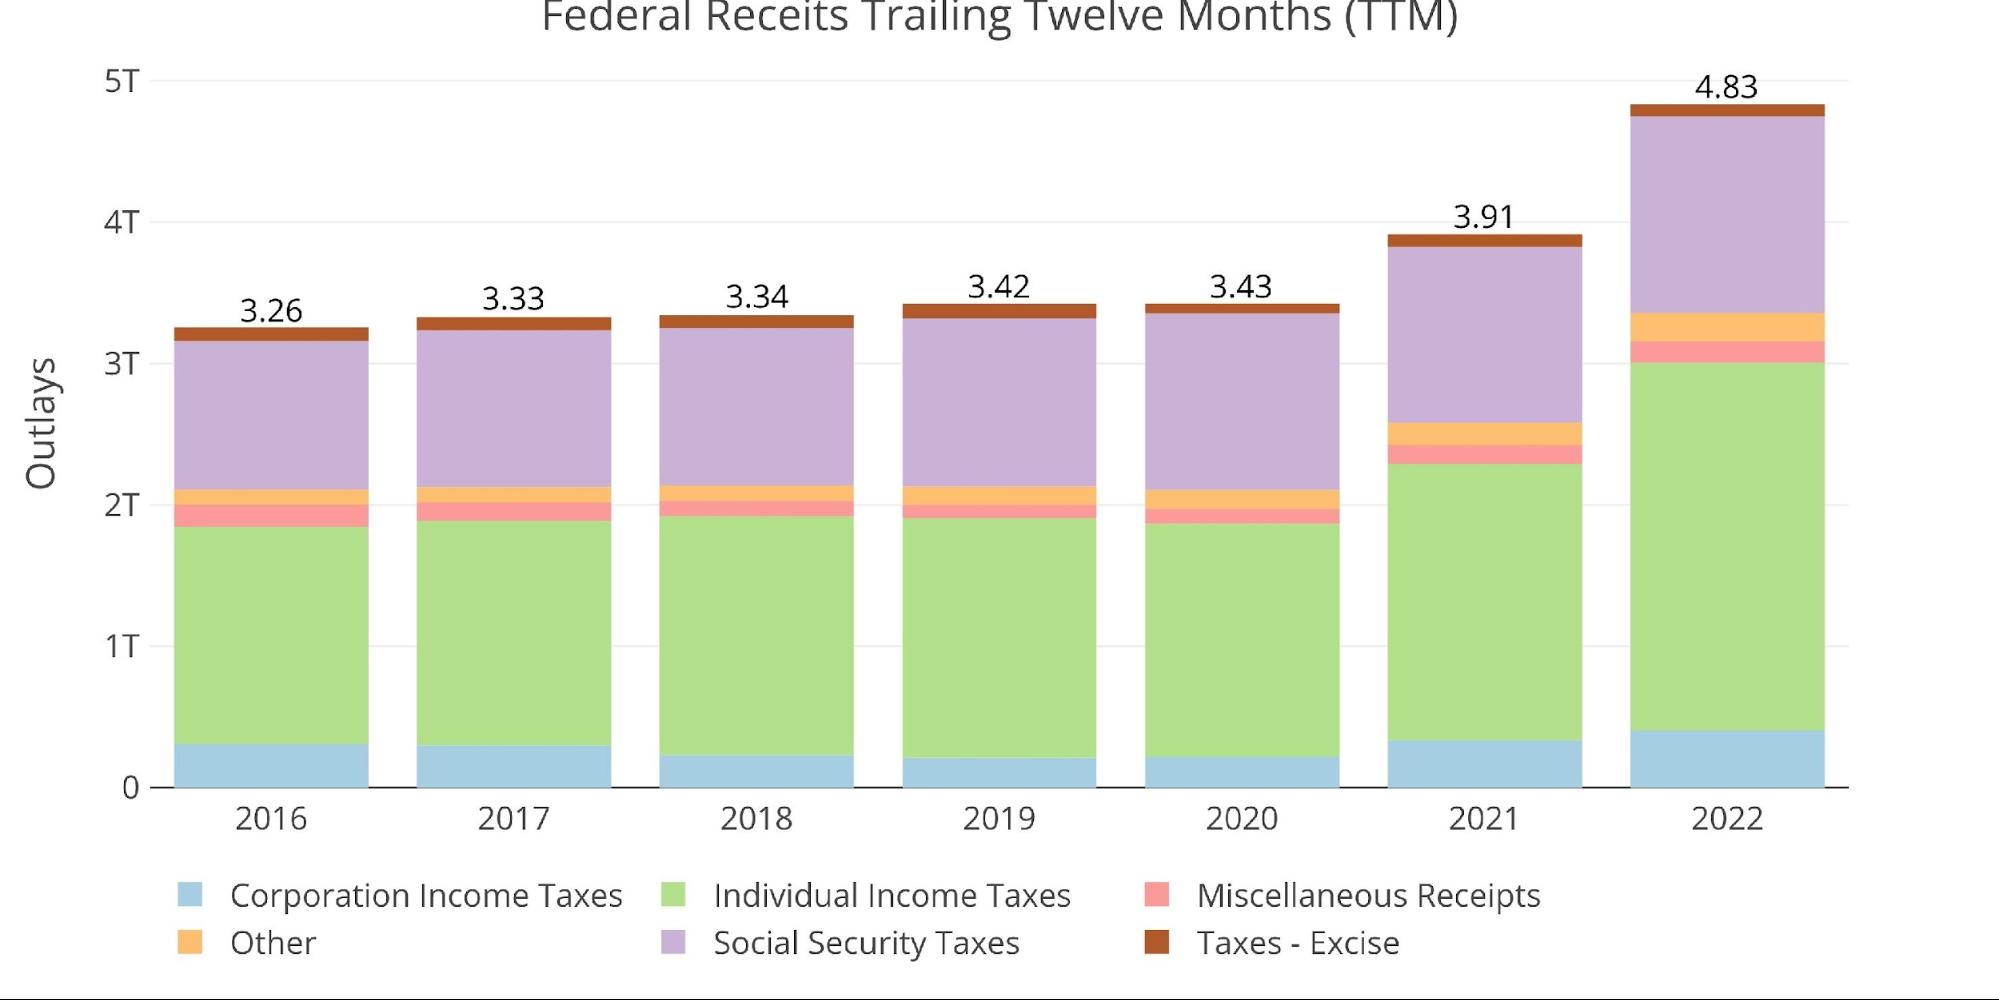
Figure: 11 Annual Federal Receipts
Unfortunately, the major windfall from this tax revenue surge is being consumed by massive spending. Income Security is the only category getting noticeably smaller.
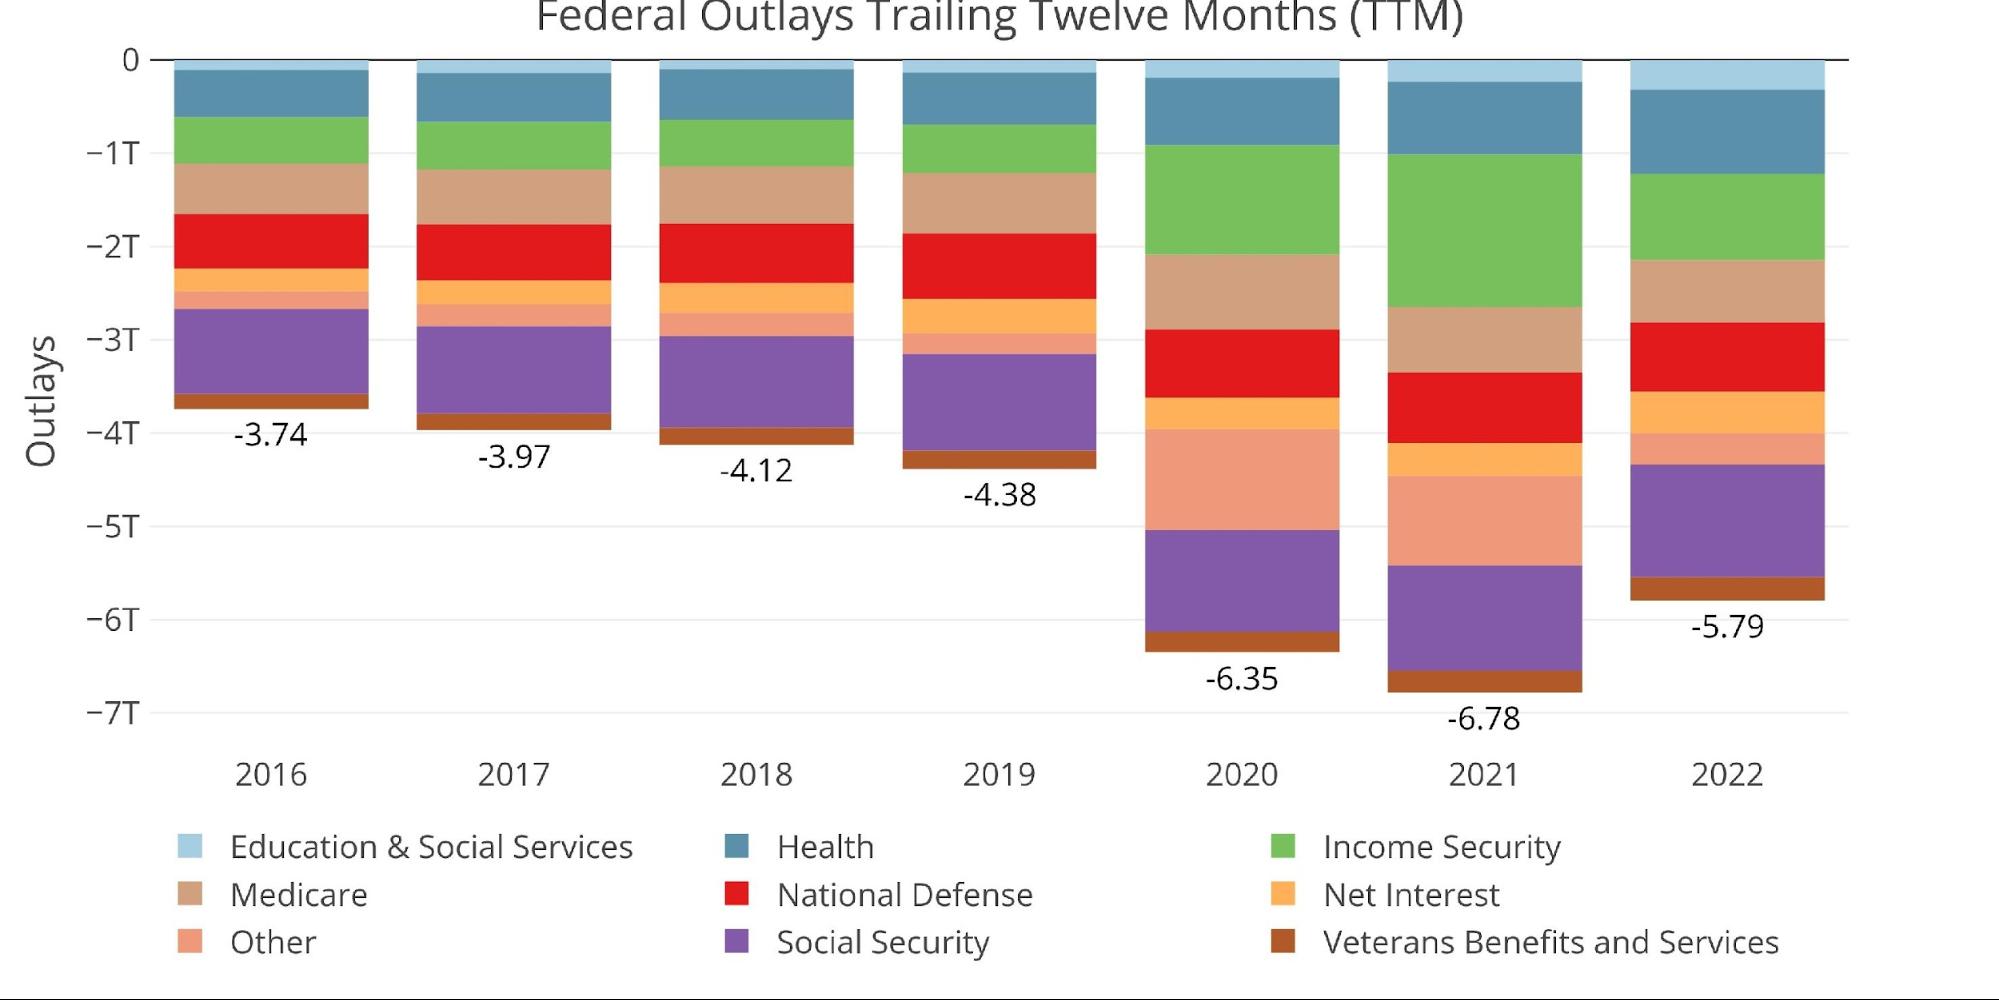
Figure: 12 Annual Federal Expenses
Due to the changing dynamics, TTM Deficit compared to GDP has returned to pre-Covid levels of 3.9%, the lowest value since October 2018.
Note: GDP Axis is set to log scale
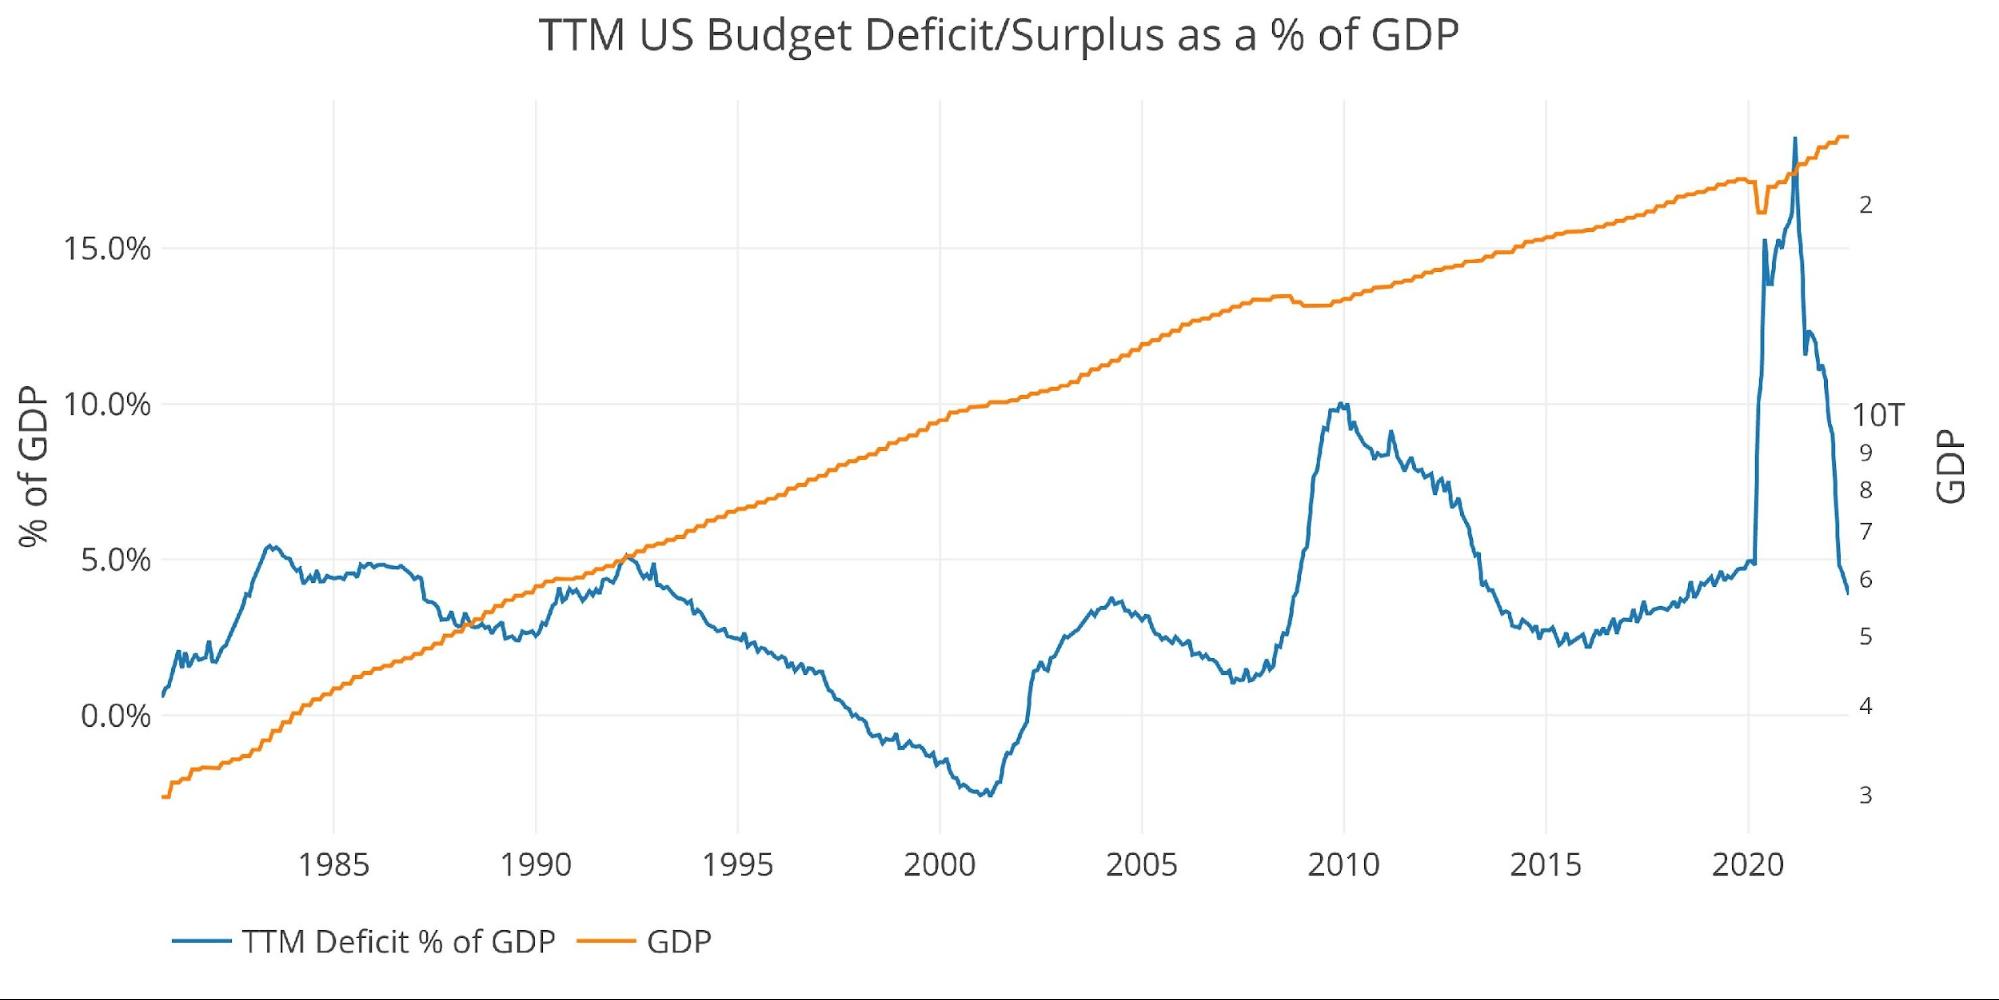
Figure: 13 TTM vs GDP
Finally, to compare the calendar year with previous calendar years, the plot below shows the YTD figures through July. Looking at just the annual calendar, this would be the smallest YTD deficit since July 2016.
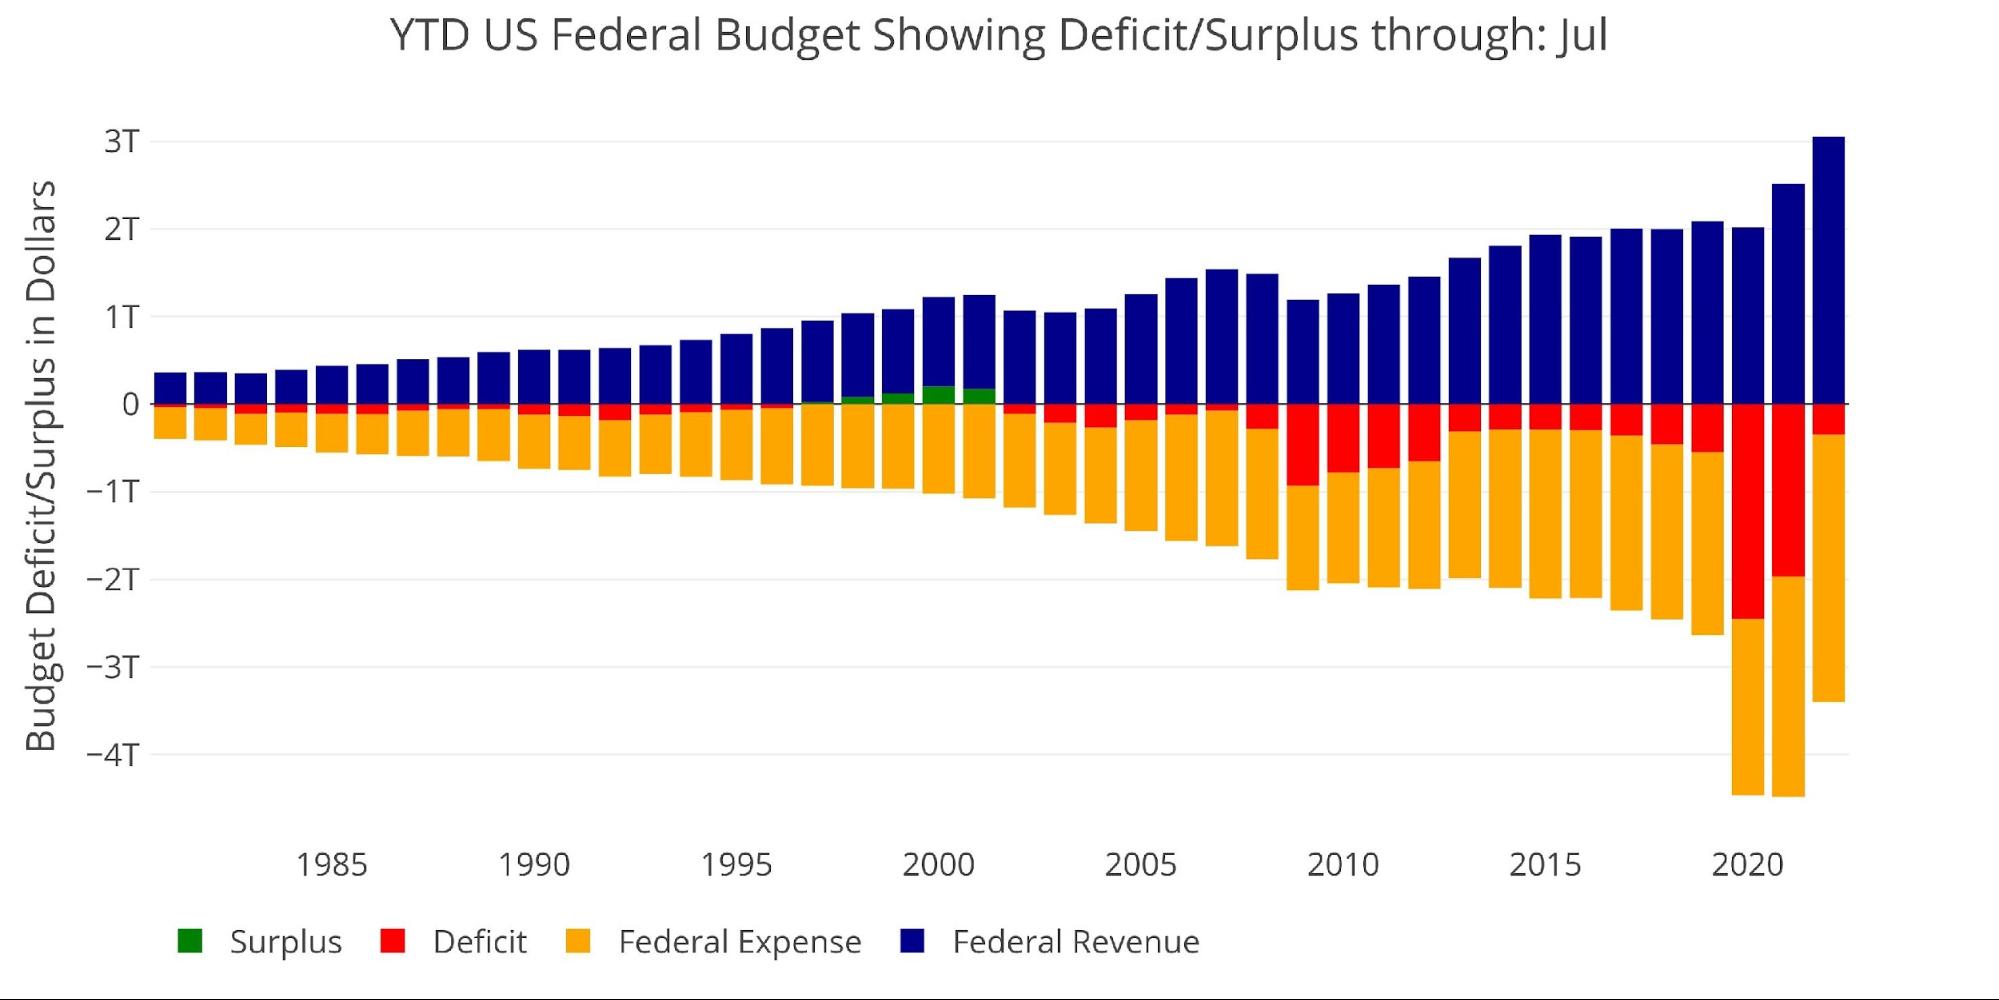
Figure: 14 Year to Date
Wrapping Up
The Federal government continues to spend far more money than it receives in taxes. Despite record high individual taxes, the government has not been able to capitalize and continues to run massive deficits.
The Fed is currently working against the Treasury. By raising rates “aggressively”, the Fed is exerting a lot of pressure on the Federal Budget. In the last year, the increased interest cost has added almost $100B to annual expenses. This is a TTM basis which means the recent rate hike has not yet been felt.
What happens when the Fed has to keep rates elevated for an extended period? This will trickle through the entire debt and continue raising the cost to borrow. The government has just added more spending with the passage of the new “Inflation Reduction Act”. This spending will have to be financed as well.
The Fed is in a box, unable to raise rates high enough to really combat inflation. Instead, they are praying and hoping inflation comes down on its own. This morning did show a let-up in the CPI, but that was almost entirely driven by the drop in Energy. All other prices are still rising. As the Fed continues to tighten, the Treasury will feel the pain. Eventually, the Fed will have to pivot or risk sending the Treasury into a debt spiral. When the Fed pivots, investors will flee to the safety of gold and silver. In a few years, current prices will look like an incredible bargain.
Data Source: Monthly Treasury Statement
Originally posted by Peter Schiff on SchiffGold.com.
The economic consequences are irreversible
This is an inflation emergency. The impact of war is rippling across the globe. It’s driving up prices more quickly than anything we’ve seen in our lifetime. And it’s barely begun. What impact will this change have on your money? How may it disrupt your financial future? How can you prepare starting right now?
To help give you an immediate answer, we just released an urgent emergency briefing.
